Fig. E.1
Download original image
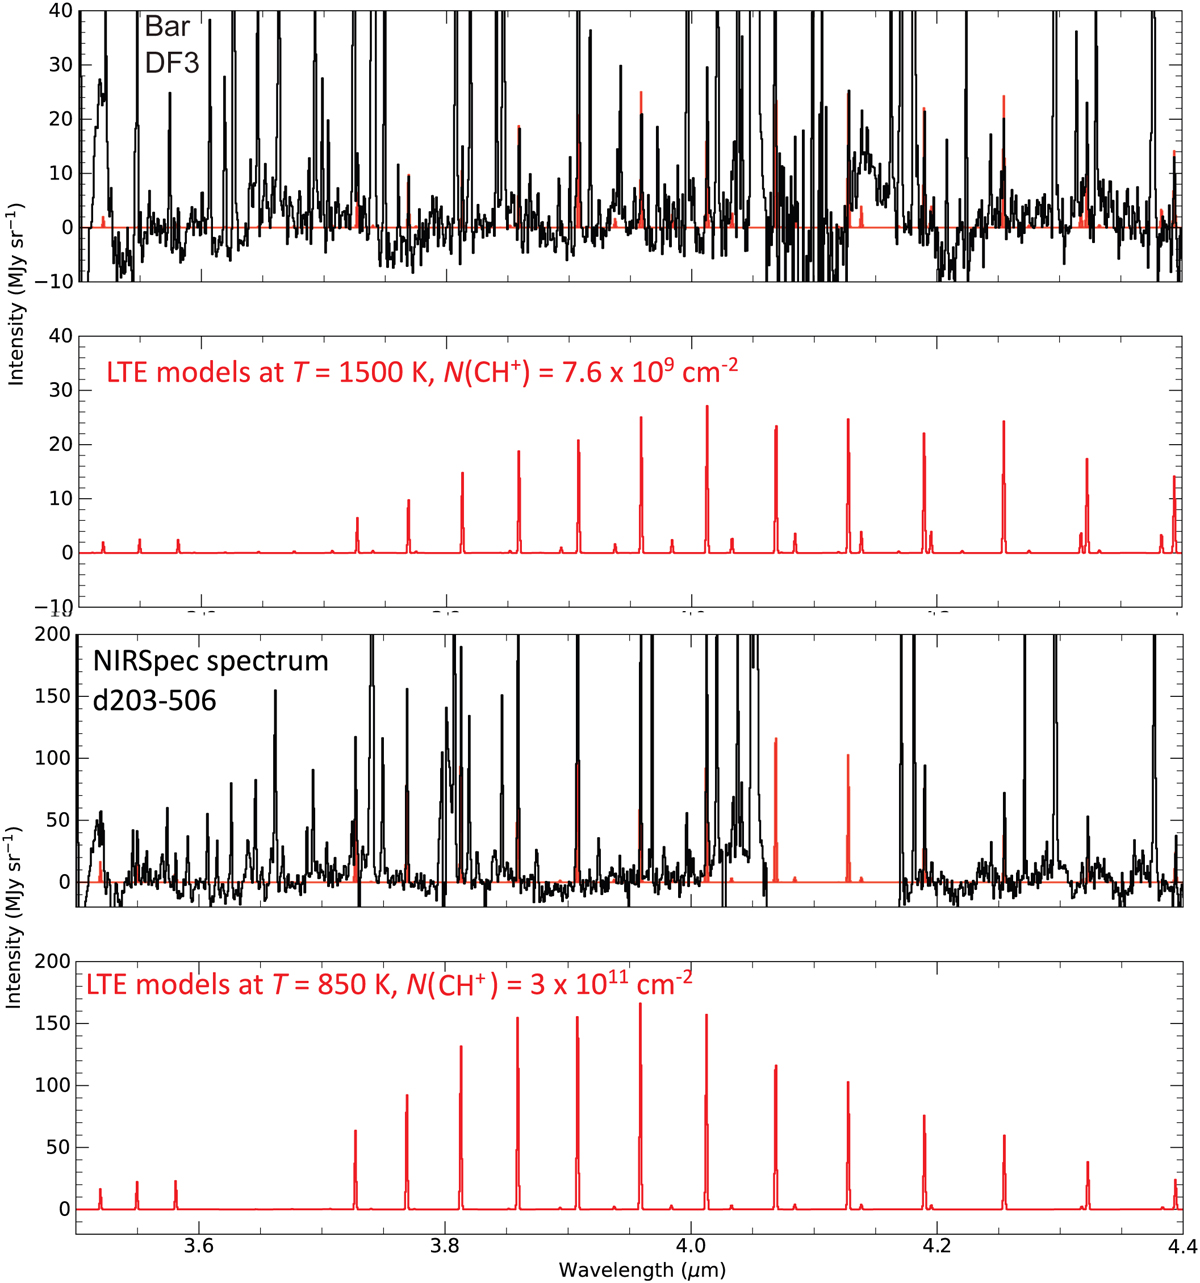
(a): (Top) CH+ continuum subtracted spectra in DF3 (see Fig. 1); (bottom) LTE model of CH+ at T = 1500 K and Nvib(CH+) = 7.6 × 109 cm−2. The column density of the fit is lower due to extinction in the line of sight. (b): (Top) CH+ continuum subtracted spectra in d203-506 (see Fig. 1). (Bottom) LTE model of CH+ at T = 850 K and Nvib(CH+) = 3 × 1011 cm−2.
Current usage metrics show cumulative count of Article Views (full-text article views including HTML views, PDF and ePub downloads, according to the available data) and Abstracts Views on Vision4Press platform.
Data correspond to usage on the plateform after 2015. The current usage metrics is available 48-96 hours after online publication and is updated daily on week days.
Initial download of the metrics may take a while.