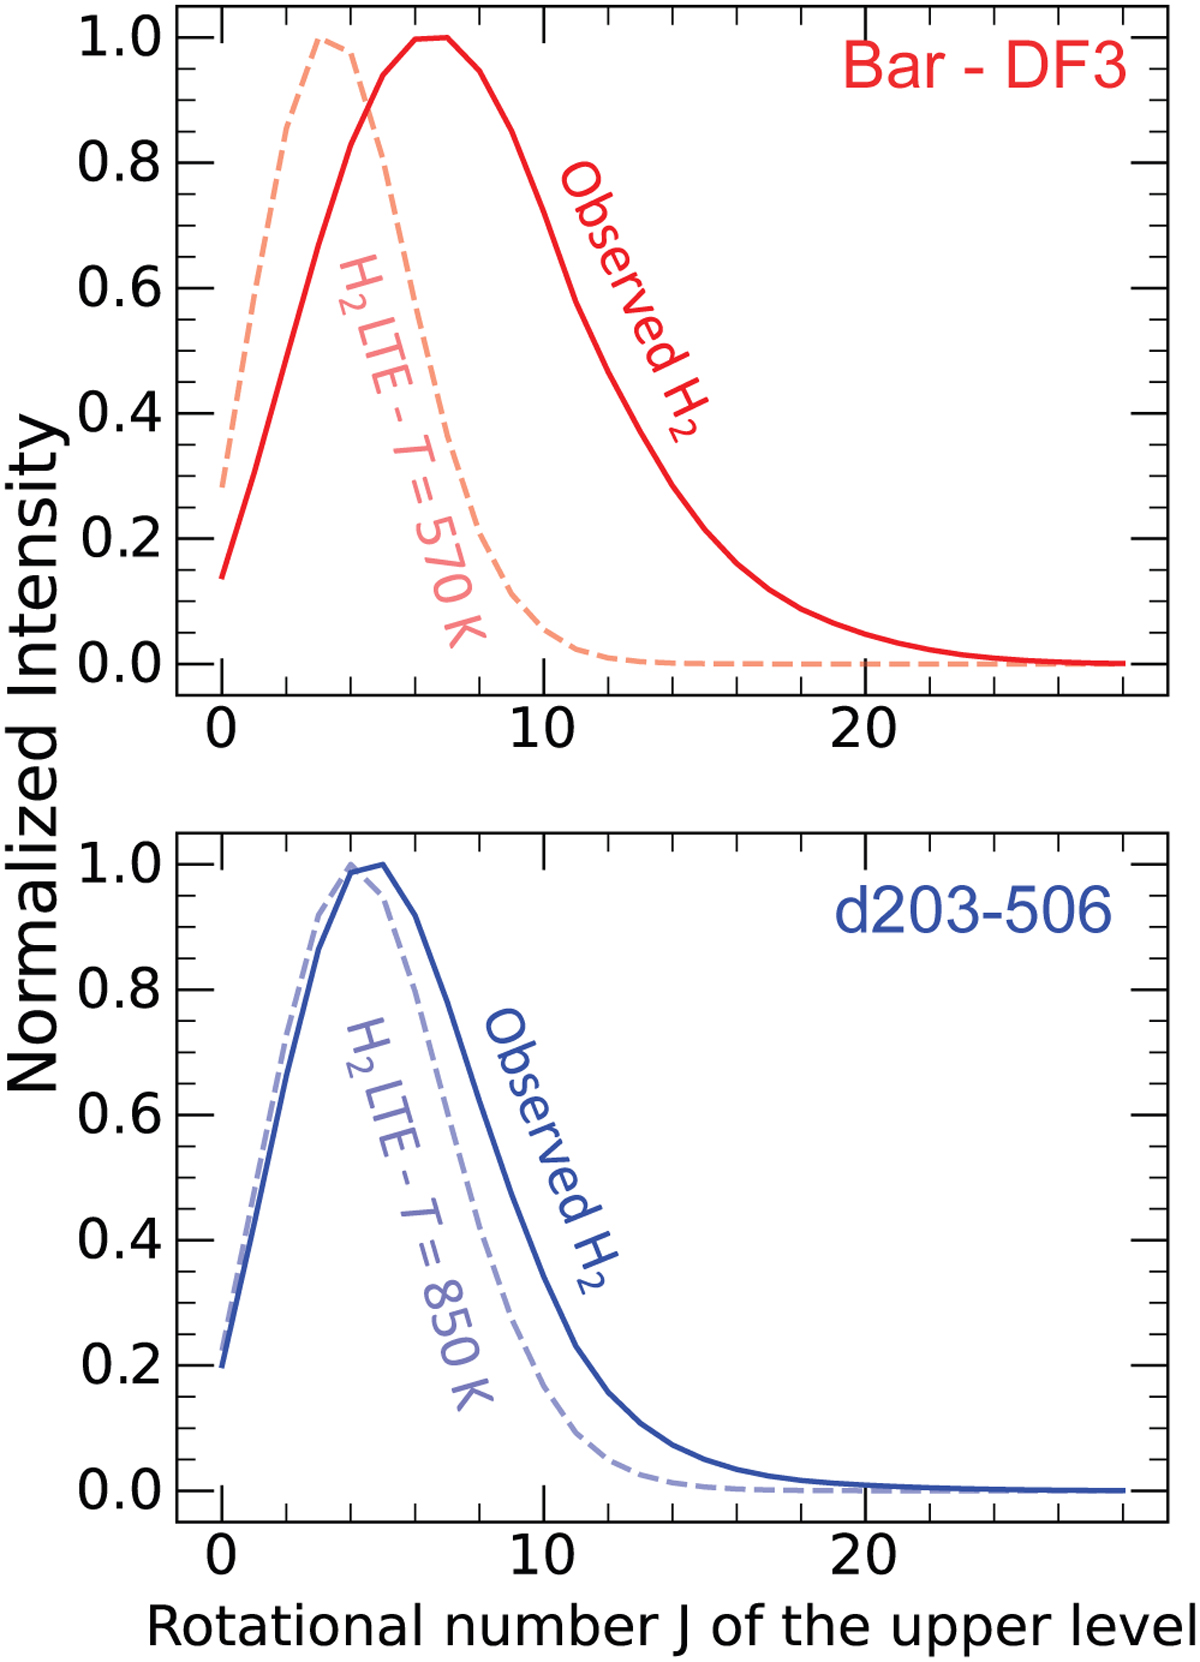
Fig. B.1
Download original image
Comparison of modeled chemical pumping intensities of CH+ using LTE distribution of H2 at the gas temperature and the observed distribution in the Orion Bar. (Top) Modeled intensities for DF3. (Bottom) Modeled intensities for d203-506. Taking into account FUV-pumped levels of H2 is highly important in DF3 compared to d203-506.
Current usage metrics show cumulative count of Article Views (full-text article views including HTML views, PDF and ePub downloads, according to the available data) and Abstracts Views on Vision4Press platform.
Data correspond to usage on the plateform after 2015. The current usage metrics is available 48-96 hours after online publication and is updated daily on week days.
Initial download of the metrics may take a while.