Open Access
Fig. 11
Download original image
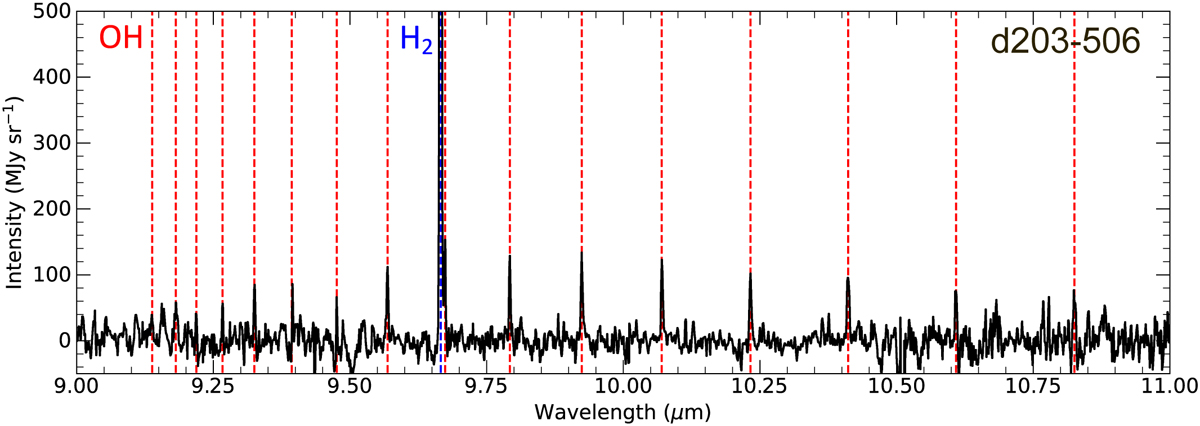
Continuum and OFF position subtracted spectrum of the disk d203-506 between 9 and 11 μm with the identified lines. The OH lines highlighted in red were previously presented and analyzed in Zannese et al. (2024).
Current usage metrics show cumulative count of Article Views (full-text article views including HTML views, PDF and ePub downloads, according to the available data) and Abstracts Views on Vision4Press platform.
Data correspond to usage on the plateform after 2015. The current usage metrics is available 48-96 hours after online publication and is updated daily on week days.
Initial download of the metrics may take a while.