Fig. 10
Download original image
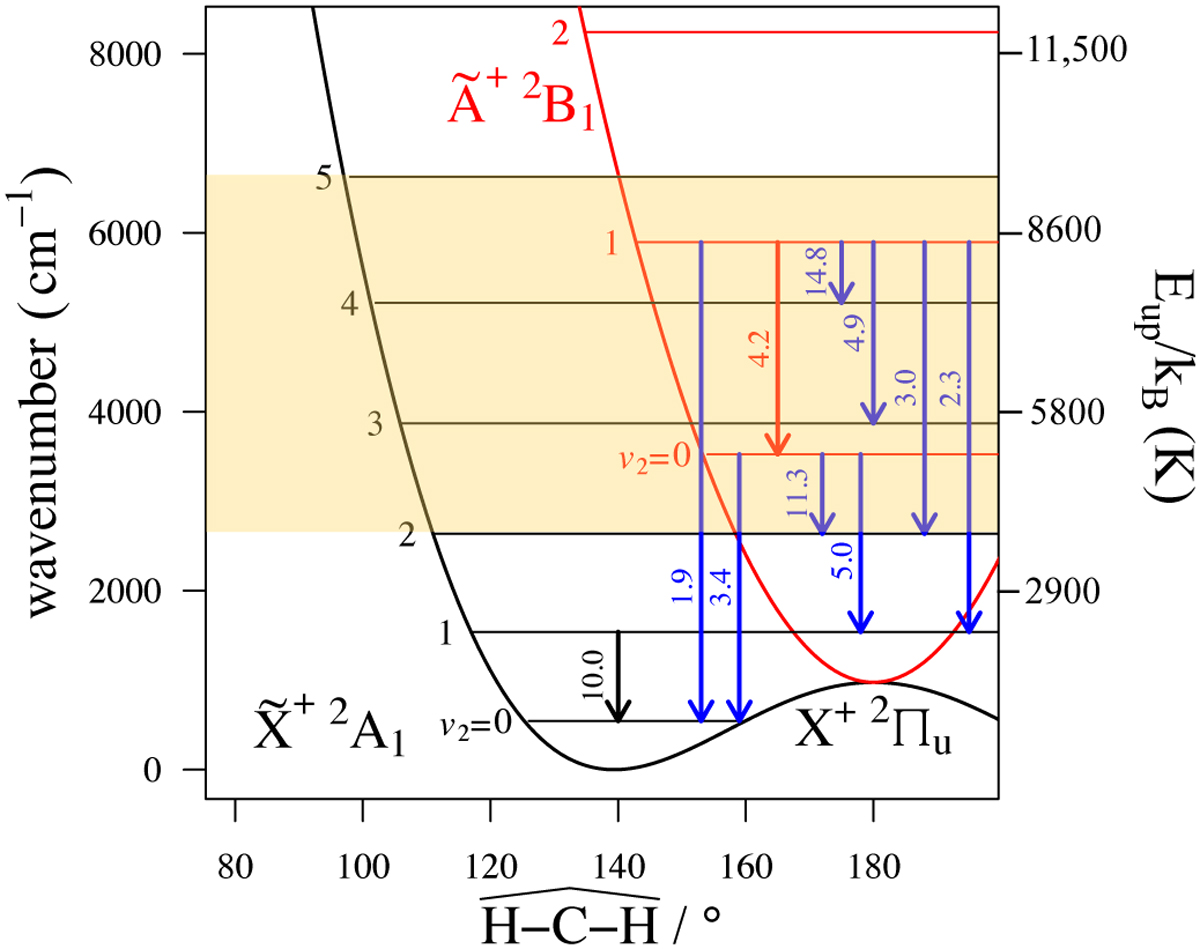
Energy level diagram of the bending levels in the two lowest electronic states of ![]() , shown as a function of the HCH bond angle in degrees with no quanta of excitation in either stretching mode. These two electronic states are strongly coupled by the Renner-Teller effect. The allowed vibrational (black for the fundamental
, shown as a function of the HCH bond angle in degrees with no quanta of excitation in either stretching mode. These two electronic states are strongly coupled by the Renner-Teller effect. The allowed vibrational (black for the fundamental ![]() state, red for the à state) and vibronic (blue) transitions are shown. Curves of potential and vibrational levels positions are adapted from Coudert et al. (2018) and Jensen et al. (1995). For each transition, the position they will fall in is labeled in μm. The box overlayed in yellow represents the upper energy levels of detected CH+ transitions.
state, red for the à state) and vibronic (blue) transitions are shown. Curves of potential and vibrational levels positions are adapted from Coudert et al. (2018) and Jensen et al. (1995). For each transition, the position they will fall in is labeled in μm. The box overlayed in yellow represents the upper energy levels of detected CH+ transitions.
Current usage metrics show cumulative count of Article Views (full-text article views including HTML views, PDF and ePub downloads, according to the available data) and Abstracts Views on Vision4Press platform.
Data correspond to usage on the plateform after 2015. The current usage metrics is available 48-96 hours after online publication and is updated daily on week days.
Initial download of the metrics may take a while.