Fig. 9.
Download original image
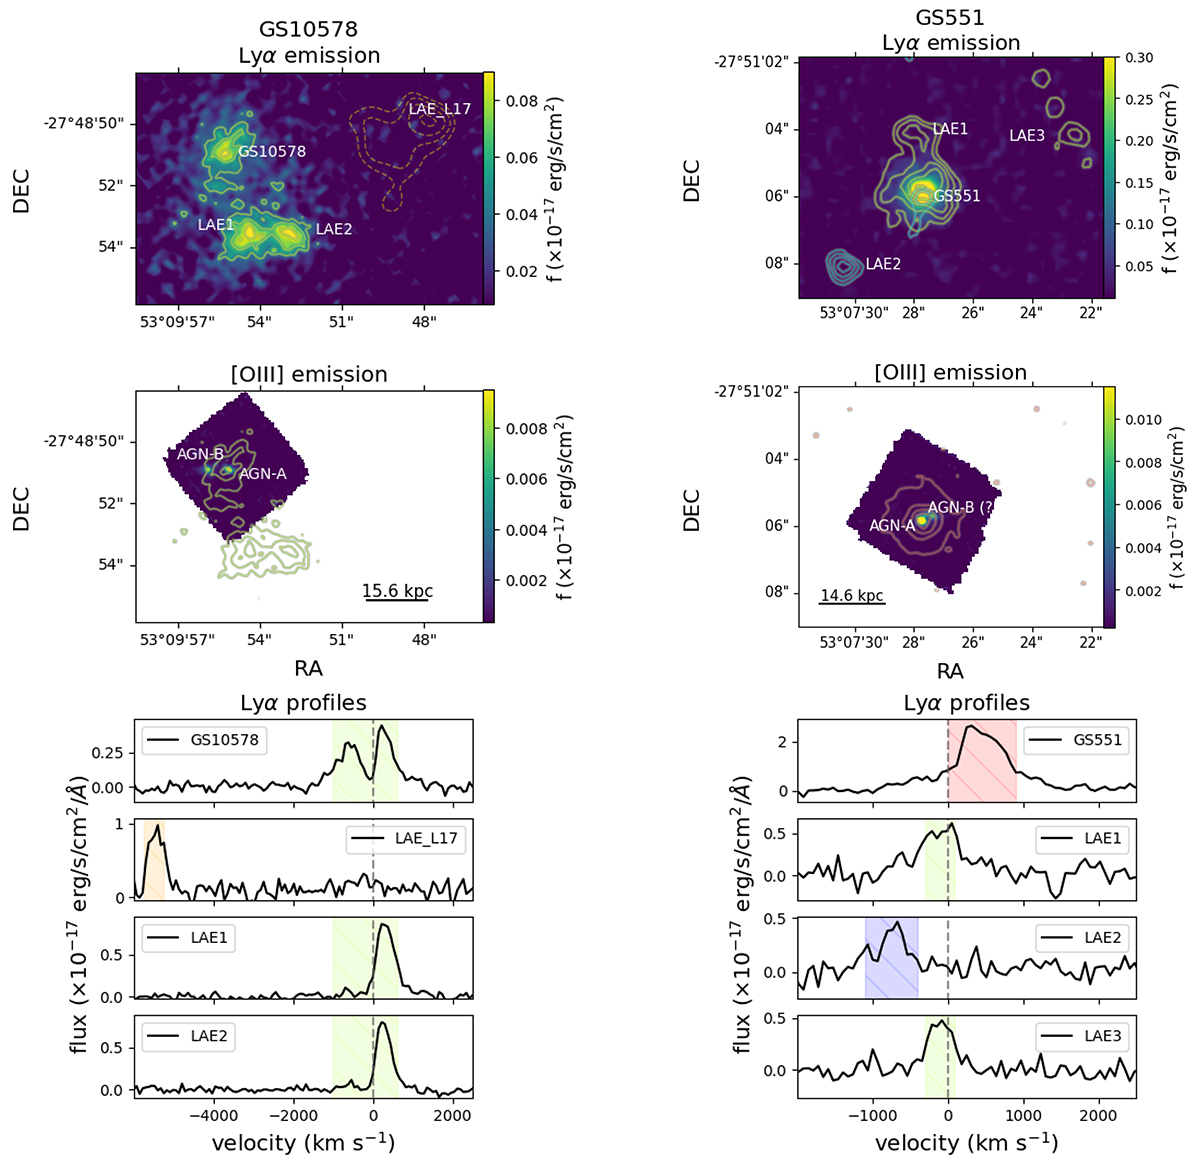
Comparison between Lyα (top) and [O III] emission maps (middle panels) for GS10578 (left) and GS551 (right), and spectra extracted from individual Lyα emitters (bottom). Both MUSE and NIRSpec images have been sampled with 0.05″/spaxel, to ease the comparison between UV and optical emission line spatial distributions. The Lyα maps are integrated over the emission profile at the location of the X-ray AGN, with overlaid contours indicating emissions at different wavelengths and highlighting nearby Lyα emitters. The bottom panels show spectra near the Lyα line for each system, in velocity space with respect to the systemic redshifts of the primary AGN; these spectra were extracted from regions with S/N > 5. In GS10578, two bright Lyα emitters (LAE1 and LAE2) are located ∼20 kpc south of the AGN; a Lyα halo at slightly lower redshift (z = 2.99) previously identified by Leclercq et al. (2017) is also marked with orange contours. GS551 features three Lyα emitters at varying distances up to ∼30 kpc; an even more distant Lyα emitter located ∼80 kpc to the north-east was also identified by den Brok et al. (2020, see their Fig. 2). The contours in the map panels are in steps of 1σ, for LAE_L17 and the GS551 companions, and in steps of 3σ (10σ) for GS10578 (GS551); all contours start from 5σ and are obtained integrating over the velocity channels shown in the bottom spectra according to their colours. These MUSE observations illustrate that GS551 and GS10578 are embedded in dense, complex environments.
Current usage metrics show cumulative count of Article Views (full-text article views including HTML views, PDF and ePub downloads, according to the available data) and Abstracts Views on Vision4Press platform.
Data correspond to usage on the plateform after 2015. The current usage metrics is available 48-96 hours after online publication and is updated daily on week days.
Initial download of the metrics may take a while.