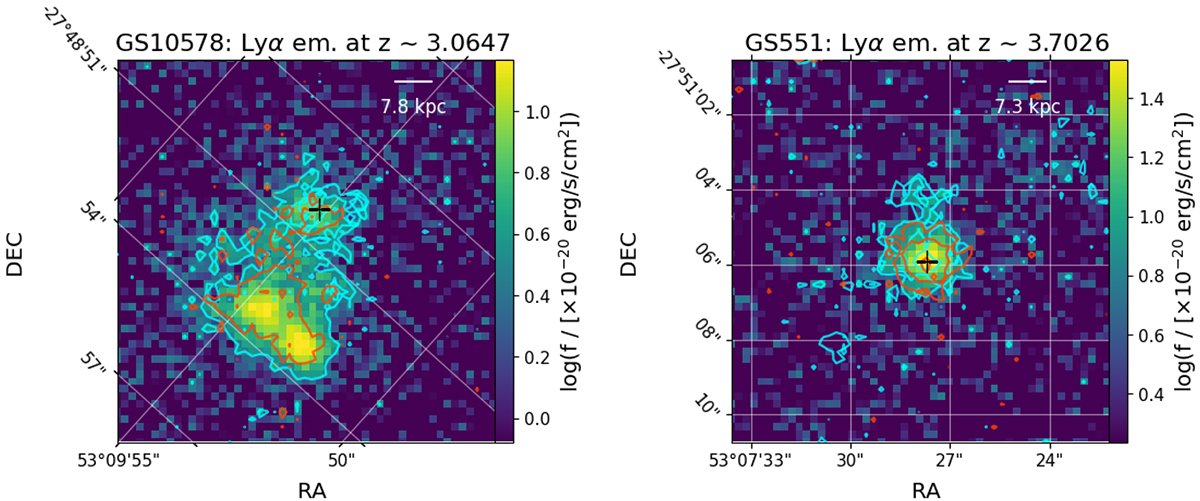
Fig. 2.
Download original image
Lyα maps of the close environments of GS10578 (left) and GS551 (right). They trace the emitting gas with v ∈ [ − 200, 200] km s−1 observed with MUSE. The cyan (orange) contours indicate the Lyα emission at 4σ in velocity bins of 400 km s−1, from −1400 to +1400 km s−1. The cross symbols identify the (NIRSpec) AGN positions. The coordinate grids highlight the different rotation of MUSE data with respect to the standard north-east up-left configuration.
Current usage metrics show cumulative count of Article Views (full-text article views including HTML views, PDF and ePub downloads, according to the available data) and Abstracts Views on Vision4Press platform.
Data correspond to usage on the plateform after 2015. The current usage metrics is available 48-96 hours after online publication and is updated daily on week days.
Initial download of the metrics may take a while.