Fig. 14.
Download original image
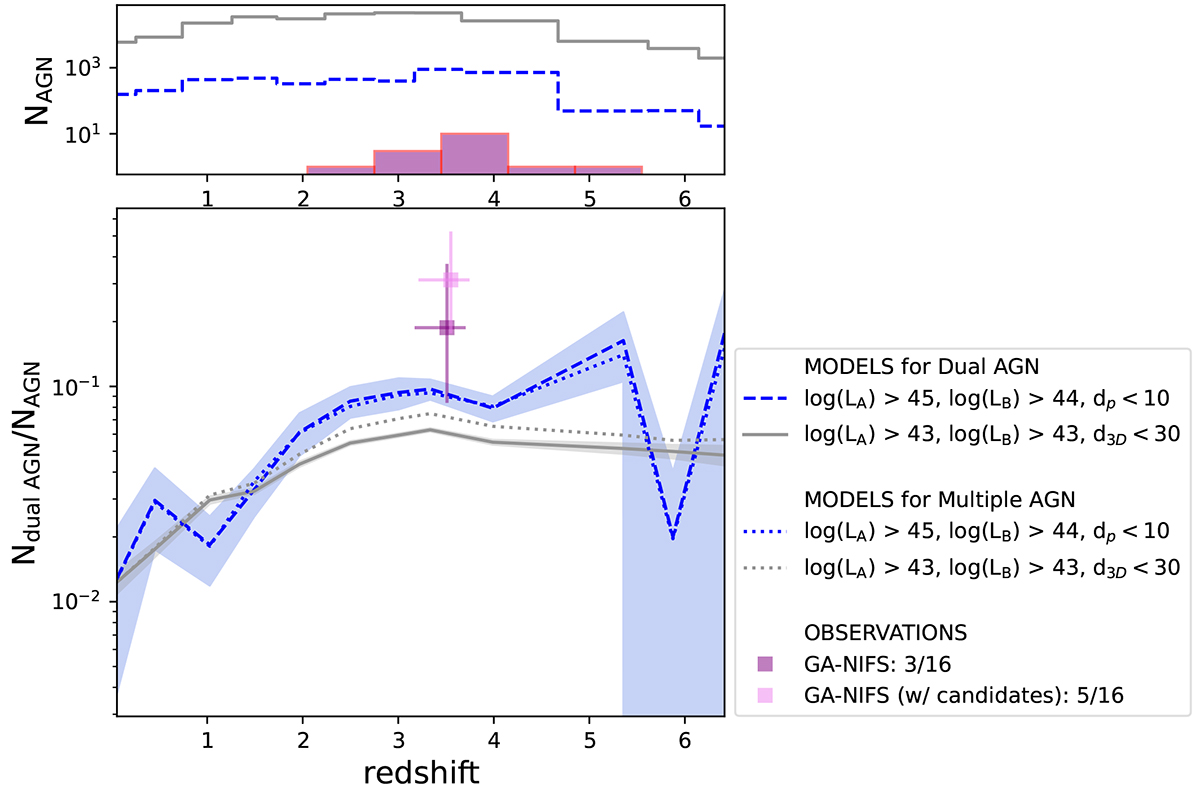
Dual AGN fraction as a function of redshift. The purple square shows the inferred dual AGN fraction from GA-NIFS observations, for the three newly discovered dual AGNs; instead, the violet symbol displays the fraction obtained also considering the two candidate dual AGNs; both measurements include 1σ Poisson errors for small numbers. The different curves represent the predicted AGN fractions obtained from an extension of the Volonteri et al. (2022) simulations up to z ∼ 6, passing different threshold criteria (as labelled). Notably, the figure shows that the GA-NIFS measurements moderately exceed the predictions obtained for thresholds that mimic our observational criteria, hence with projected distances dp < 10 kpc, log(Lbol, A) > 45 (for the primary AGN and the parent population) and log(Lbol, B) > 44 (for the secondary AGN), shown with a blue dashed curve (and Poissonian 1σ intervals in lightblue). The top panel shows the parent sample distributions of GA-NIFS sources (purple histogram) and simulated AGNs (blue for log(Lbol, A) > 45, grey for log(Lbol, A) > 43); we note that simulations at z > 5 suffer from poor statistics.
Current usage metrics show cumulative count of Article Views (full-text article views including HTML views, PDF and ePub downloads, according to the available data) and Abstracts Views on Vision4Press platform.
Data correspond to usage on the plateform after 2015. The current usage metrics is available 48-96 hours after online publication and is updated daily on week days.
Initial download of the metrics may take a while.