Fig. 13.
Download original image
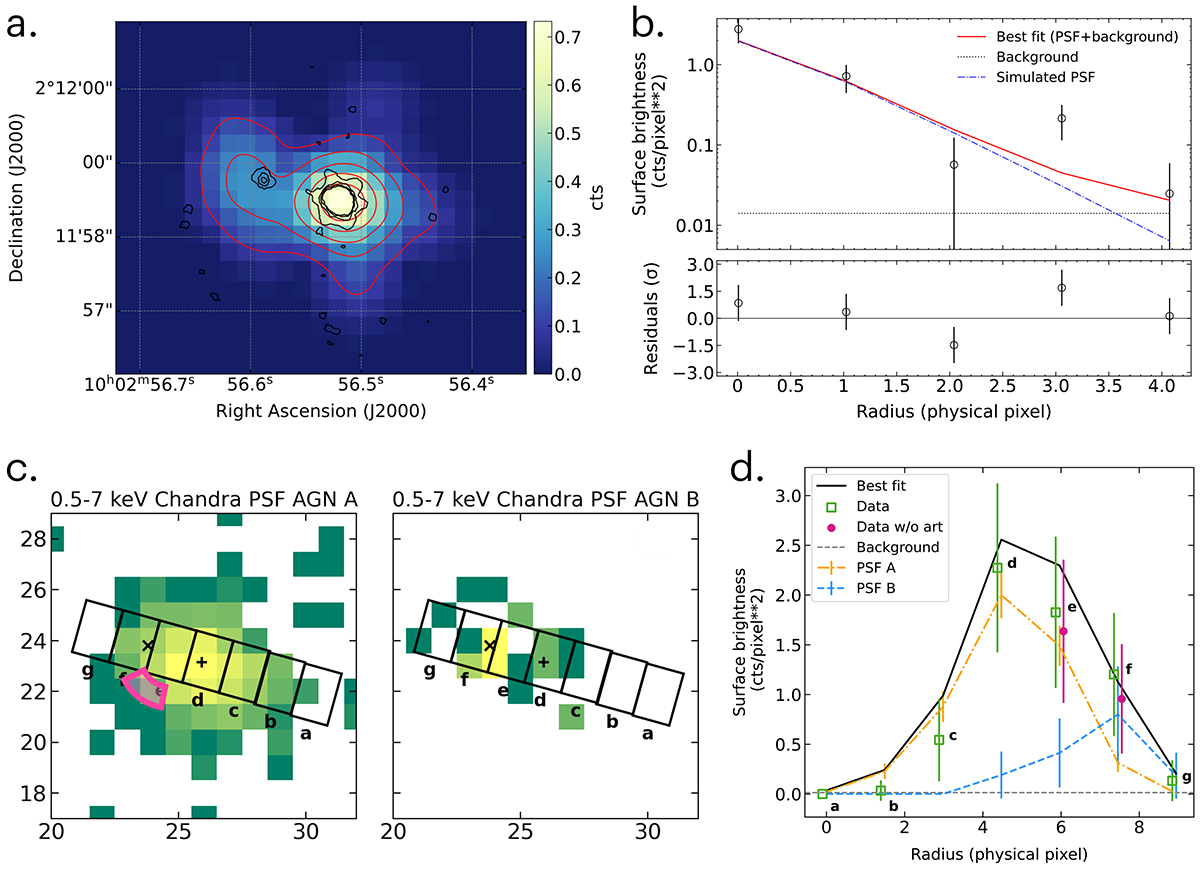
COS1638 X-ray emission. (a) Chandra image (obsID 15253) in the 0.5−7 keV observed-frame energy band, smoothed and sub-binned (1/2 pixel binning, i.e. 0.25″ pixel scale) for visualisation purposes. NIRSpec [O III] and X-ray contours are overlayed in black and in red, respectively. (b) radial profile of COS1638 in obsID 15253 extracted from the native-pixel event file, after masking the pixels affected by the PSF hook, using a set of 5 annuli (δr ≃ 0.5″) centred on the peak of the source emission (which corresponds to COS1638-A). The radial profile was fit with the radial PSF model (see Sect. 5.6) plus a constant set to the measured background level (model: PSF+constant). The red solid line shows the best fit, the blue dash-dotted line shows the simulated PSF profile, while the black dotted line shows the measured background level. The observed radial profile shows hints (∼2σ) of an X-ray excess at the distance of COS1638-B (∼2−3 native Chandra pixels, corresponding to ∼1.2″). (c) 0.5−7 keV images of the simulated PSFs at the positions of COS1638-A (marked with a ‘+’) and COS1638-B (‘x’). The lettered boxes show the extraction regions of the radial profiles in panel d. The magenta region shows the position of the hook feature, whose corresponding pixels were masked in the Chandra data before extracting the radial profiles. (d) 0.5−7 keV (observed energy range) radial profiles of COS1638 extracted from ObsID 15253, from masked (magenta) and unmasked (green) data. The black solid line marks the total X-ray profile obtained from fitting the data with the two PSFs (dash-dotted and blue dashed lines for COS1638-A and COS1638-B, respectively) and the background (grey dashed line). Thus, the X-ray morphology overall hints at the presence of a second peak at the position of COS1638-B.
Current usage metrics show cumulative count of Article Views (full-text article views including HTML views, PDF and ePub downloads, according to the available data) and Abstracts Views on Vision4Press platform.
Data correspond to usage on the plateform after 2015. The current usage metrics is available 48-96 hours after online publication and is updated daily on week days.
Initial download of the metrics may take a while.