Fig. 12.
Download original image
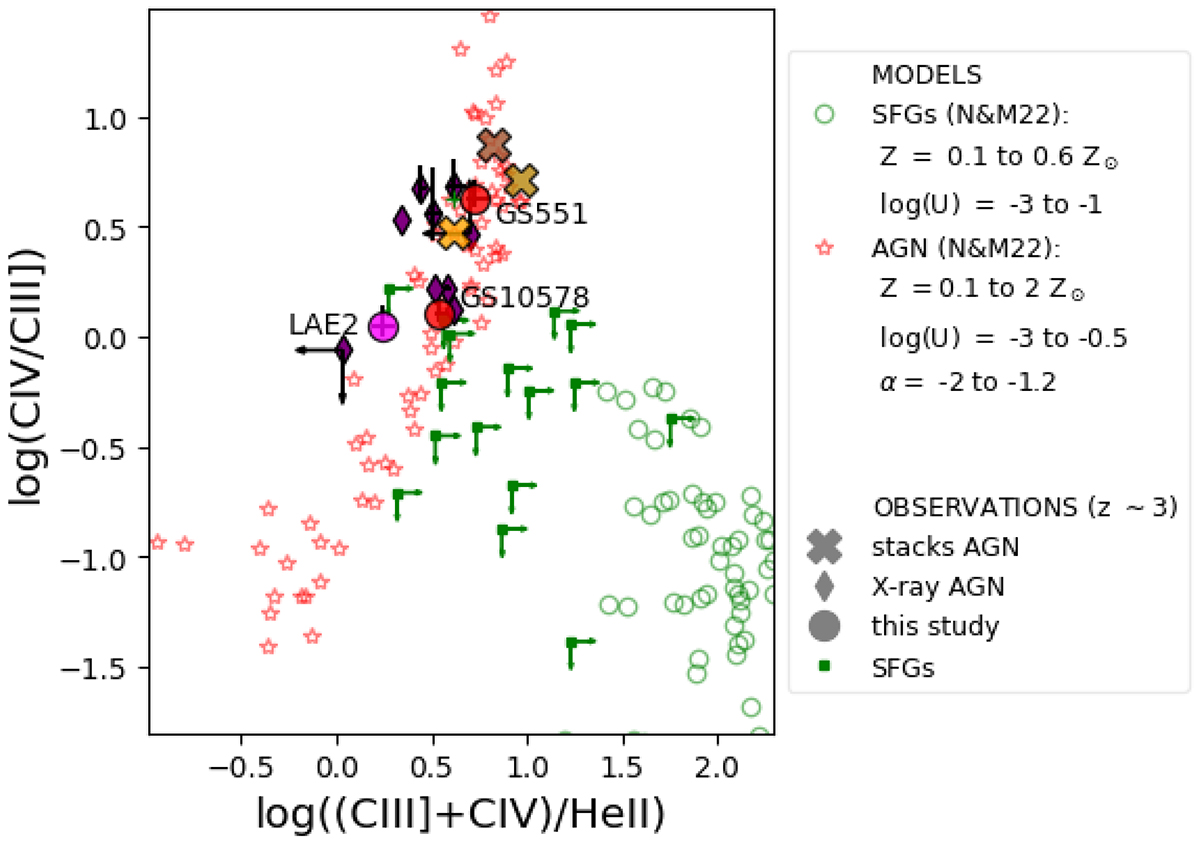
UV diagnostic diagram. Small green and red empty symbols represent model predictions for SFGs and AGNs, respectively, from Nakajima & Maiolino (2022). See the legend for details about model parameters. Large circles refer to the MUSE measurements of the three sources in our sample, as labelled; MUSE resolution does not allow us to separate the contribution of primary and secondary AGNs, but GS551 and GS10578 line ratios are likely dominated by the primary (brightest) AGN. The figure also shows individual X-ray AGNs (diamonds) and measurements from stacked AGN spectra (crosses), as well as SFGs at z ∼ 3 from the literature (green squares; see Sect. 5.2). GS551, GS10578 and LAE2 occupy the AGN region of the diagram.
Current usage metrics show cumulative count of Article Views (full-text article views including HTML views, PDF and ePub downloads, according to the available data) and Abstracts Views on Vision4Press platform.
Data correspond to usage on the plateform after 2015. The current usage metrics is available 48-96 hours after online publication and is updated daily on week days.
Initial download of the metrics may take a while.