Fig. 6
Download original image
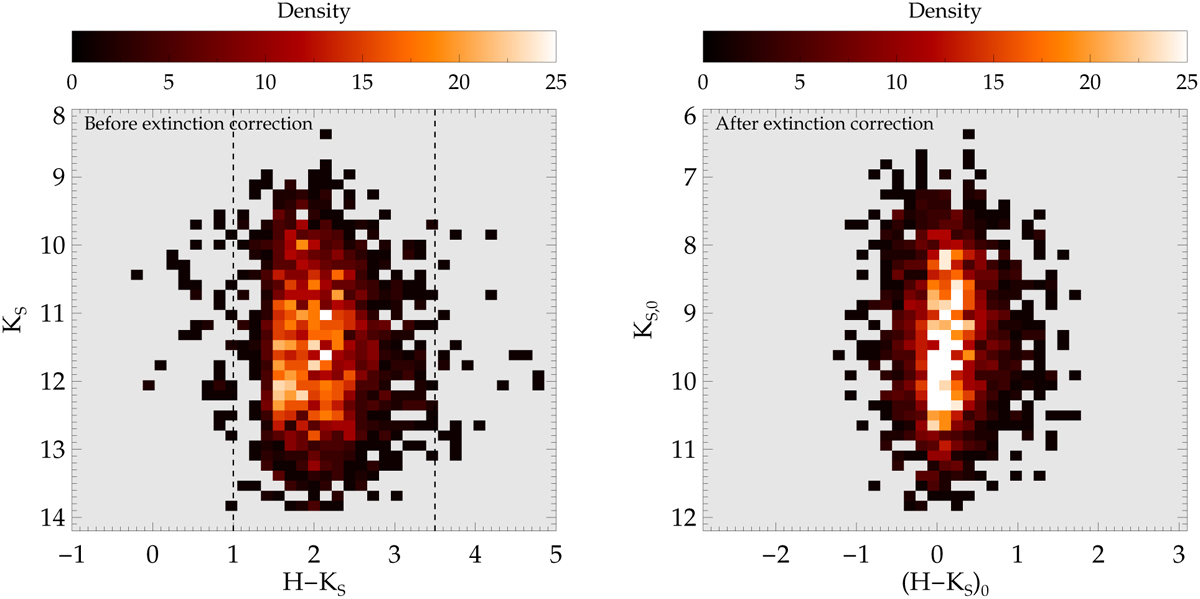
Colour-magnitude diagram of the sample with stellar parameter fit. Left panel: observed H − KS versus KS diagram for all stars with a stellar parameter fit. The vertical dashed lines enclose the stars classified as being located in the GC. Right panel: extinction corrected (H − KS )0 versus KS,0 diagram of stars with a stellar parameter fit and classified as being located in the GC.
Current usage metrics show cumulative count of Article Views (full-text article views including HTML views, PDF and ePub downloads, according to the available data) and Abstracts Views on Vision4Press platform.
Data correspond to usage on the plateform after 2015. The current usage metrics is available 48-96 hours after online publication and is updated daily on week days.
Initial download of the metrics may take a while.