Fig. 4
Download original image
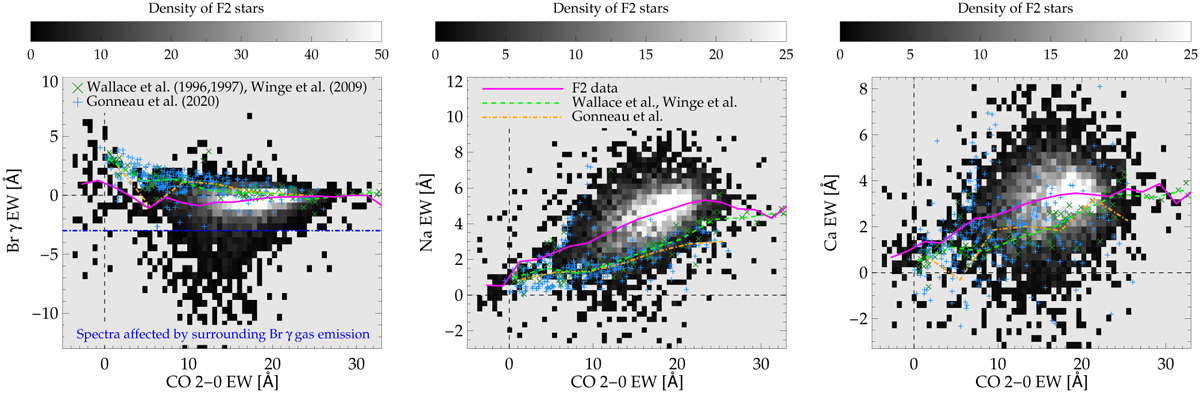
Spectral EW of Br γ, Na I, and Ca I as a function of the EW of CO 2–0. The density maps show measurements on our extracted spectra after a quality cut on the required S/N. The green x-symbols are ∼100 stars in the Wallace & Hinkle (1996, 1997) and Winge et al. (2009) spectral libraries, and the blue plus-symbols are >400 Milky Way stars from Gonneau et al. (2020). Magenta solid lines, green dashed (for Wallace & Hinkle 1996, 1997; Winge et al. 2009), and orange dot-dashed lines (Gonneau et al. 2020) show the robust mean as function of EWCO. Stars with a Br γ measurement below the dot-dashed horizontal blue line in the left panel are affected by Br γ gas emission at the centre of the NSC.
Current usage metrics show cumulative count of Article Views (full-text article views including HTML views, PDF and ePub downloads, according to the available data) and Abstracts Views on Vision4Press platform.
Data correspond to usage on the plateform after 2015. The current usage metrics is available 48-96 hours after online publication and is updated daily on week days.
Initial download of the metrics may take a while.