Fig. 3
Download original image
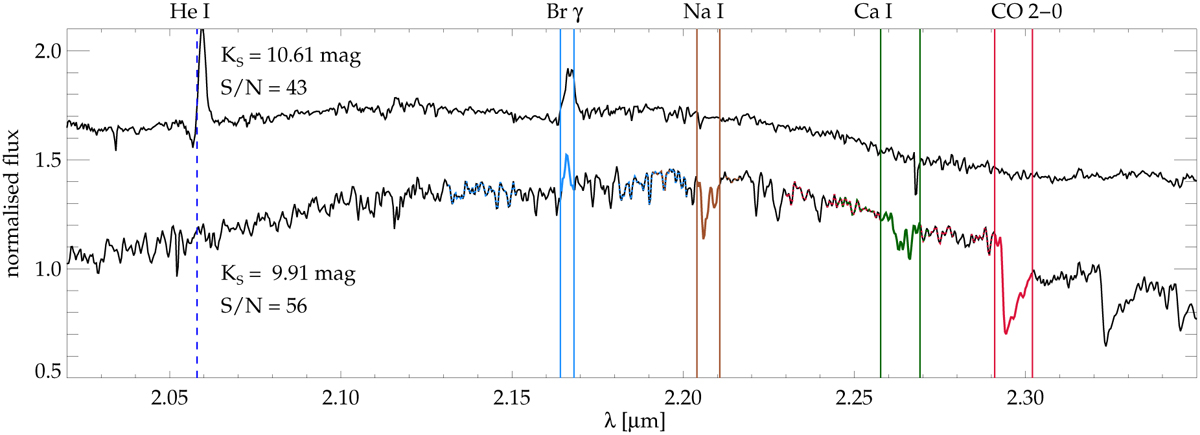
Example spectra of a hot star (top) and a cool star (bottom). Both spectra are normalised by their median flux, and a small offset is added to improve visibility. The vertical lines indicate several spectral features used for the analysis, labelled on the top. Both spectra have Br γ emission due to surrounding gas (the hot star has even He I emission), but only the cool star has strong Na I, Ca I and CO 2–0 absorption features, and plenty of other metal lines. The regions used to measure the spectral indices are marked by different colours in the cool star spectrum, solid lines for the feature, and dotted lines for the pseudo-continuum regions. We annotate the KS and S/N (computed using the PPXF fit residual) for each star.
Current usage metrics show cumulative count of Article Views (full-text article views including HTML views, PDF and ePub downloads, according to the available data) and Abstracts Views on Vision4Press platform.
Data correspond to usage on the plateform after 2015. The current usage metrics is available 48-96 hours after online publication and is updated daily on week days.
Initial download of the metrics may take a while.