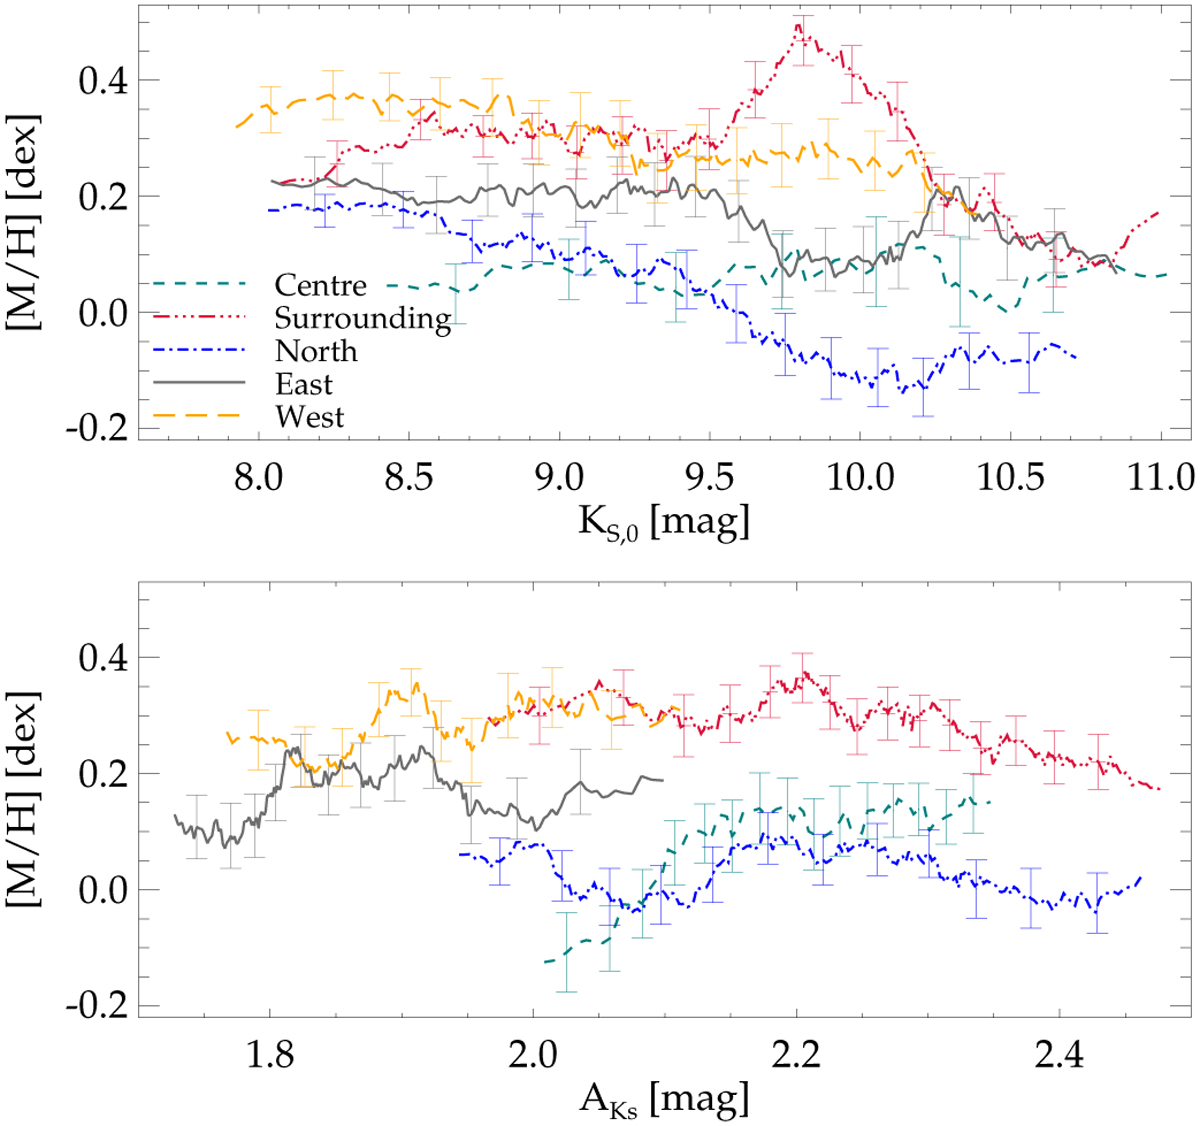
Fig. C.3
Download original image
Moving average [M/H] profile of GC late-type stars in several regions as a function of different photometric properties. The panels show, from top to bottom, extinction corrected KS,0, extinction AKS. The regions are as defined in Table 2 and shown with colours and symbols as described in the upper panel legend. The average is computed on 50 (centre), 80 (East and West), or 100 stars (surrounding and north regions), as the number of stars varies in these regions. Uncertainties of [M/H] are Poisson errors.
Current usage metrics show cumulative count of Article Views (full-text article views including HTML views, PDF and ePub downloads, according to the available data) and Abstracts Views on Vision4Press platform.
Data correspond to usage on the plateform after 2015. The current usage metrics is available 48-96 hours after online publication and is updated daily on week days.
Initial download of the metrics may take a while.