Fig. 17
Download original image
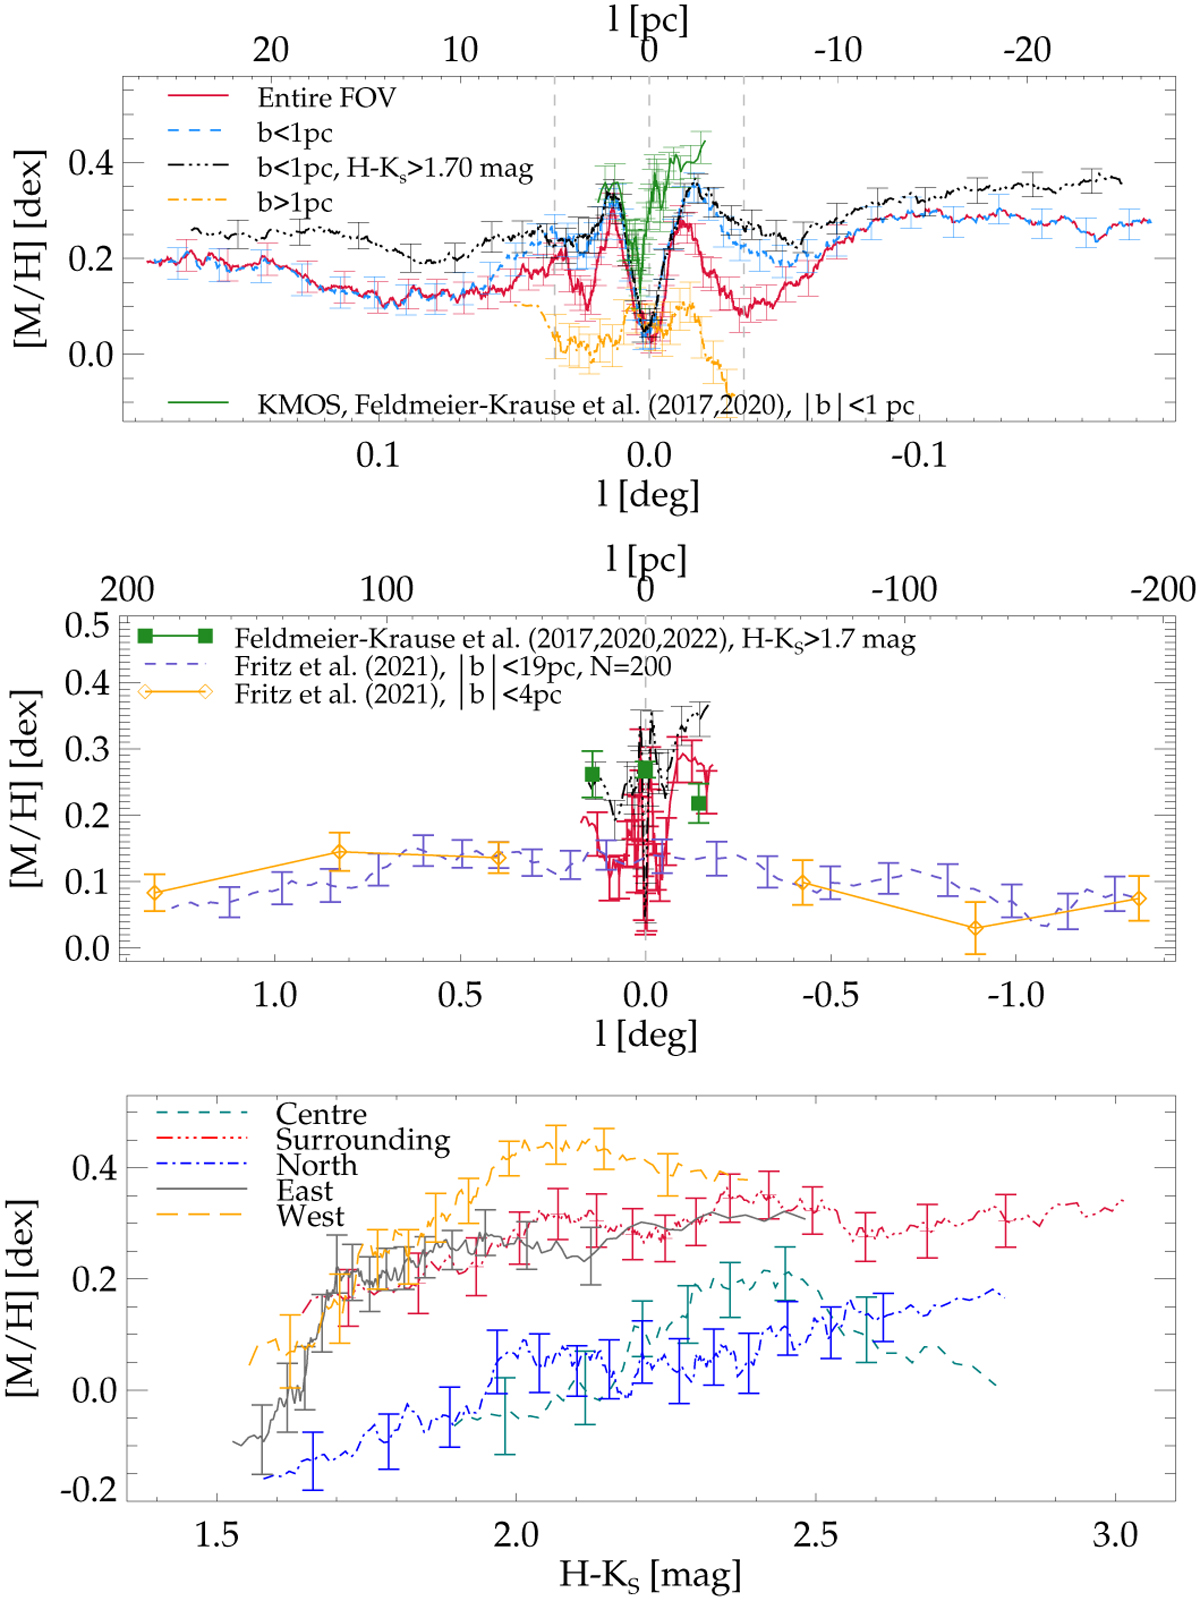
Moving average [M/H] profile of GC late-type stars. Top panel: profile along Galactic longitude, centred on Sgr A★. Red lines denote the average over the entire FOV. Blue dashed lines are for stars at b<1 pc, that is, without stars located in the northern region of the FOV (shown as orange dot-dashed line), and the black dot-dashed line excludes stars with H − KS <1.7 mag. The average was computed with 200 stars; uncertainties are Poisson errors. The green line denotes the moving average of [M/H] of 100 stars from Feldmeier-Krause et al. (2017a, 2020). Vertical dashed lines denote the NSC Re =5 pc, and the centre at 0 pc. Middle panel: same as the top panel but including NSD data from Fritz et al. (2021), shown as purple dashed and solid orange lines with diamond symbols, and Feldmeier-Krause (2022), shown together with the Feldmeier-Krause et al. (2017a, 2020) data as green square symbols. To aid visibility, we plot error bars only every ∼20 pc. Bottom panel: profile along the observed H − KS for different regions in our FOV and averaged over 50–100 stars to account for the lower and different number of stars per field.
Current usage metrics show cumulative count of Article Views (full-text article views including HTML views, PDF and ePub downloads, according to the available data) and Abstracts Views on Vision4Press platform.
Data correspond to usage on the plateform after 2015. The current usage metrics is available 48-96 hours after online publication and is updated daily on week days.
Initial download of the metrics may take a while.