Fig. 16
Download original image
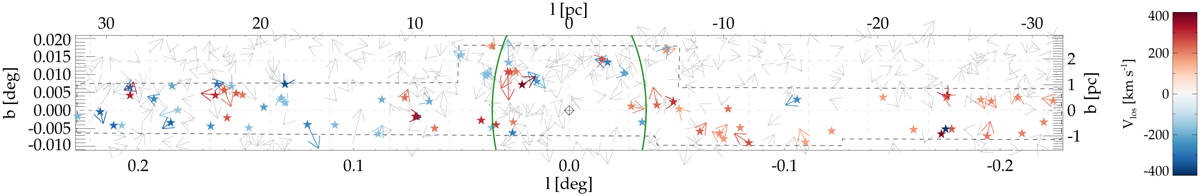
Spatial distribution and 3D motions of high-velocity stars in the FOV. The blue-to-red coloured symbols denote high-velocity stars, colourcoded by their VLOS. The arrows denote the direction of their proper motion from Shahzamanian et al. (2022), but the arrow length is multiplied by a factor of 3000 for better visualisation. The grey arrows are a subset (2.5%) of the Shahzamanian et al. (2022) proper motions to illustrate the distribution of proper motions in this region. Black dashed lines denote the approximate outline of our FOV. The x-axis and y-axis have different scales; therefore, proper motions along the y-axis appear larger. The green circle denotes 1 Re = 5 pc of the NSC.
Current usage metrics show cumulative count of Article Views (full-text article views including HTML views, PDF and ePub downloads, according to the available data) and Abstracts Views on Vision4Press platform.
Data correspond to usage on the plateform after 2015. The current usage metrics is available 48-96 hours after online publication and is updated daily on week days.
Initial download of the metrics may take a while.