Fig. 9
Download original image
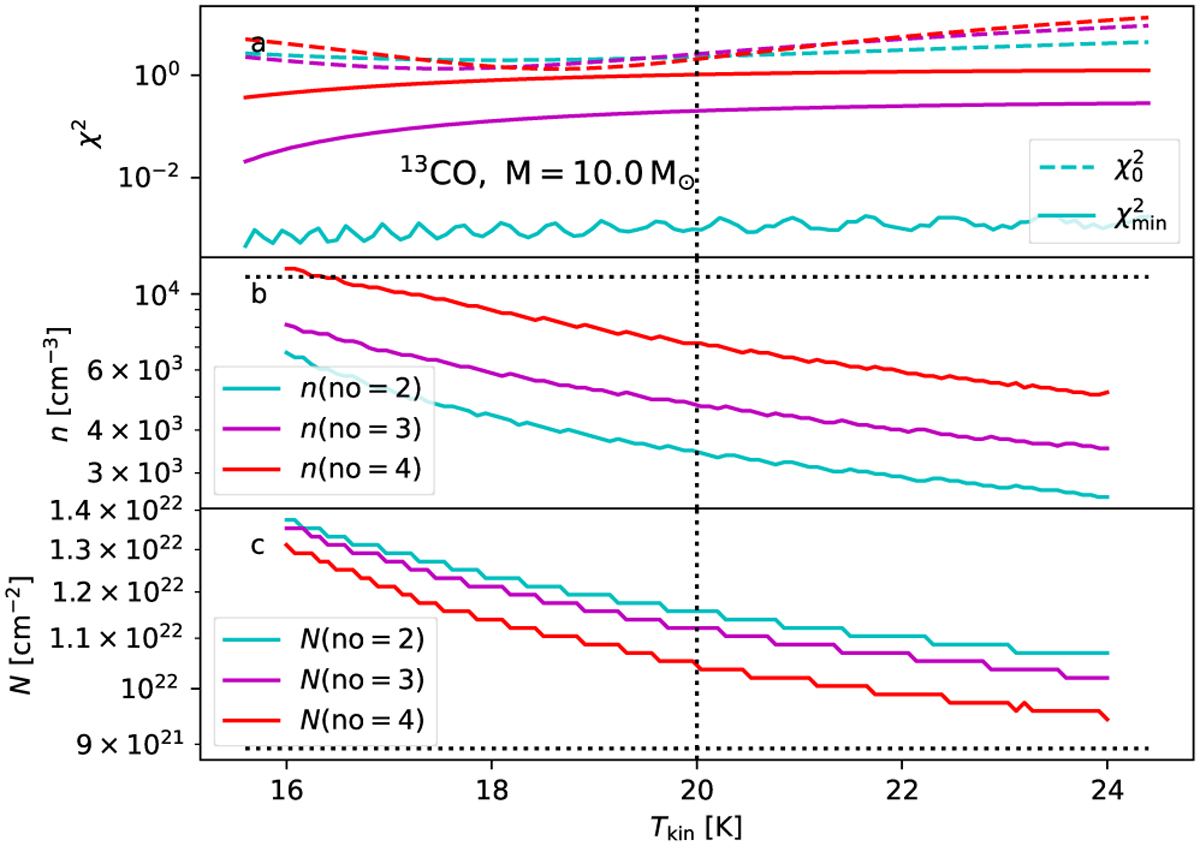
Change in the minimum-χ2 PEP solution for 13CO spectra as a function of Tkin. The model is a 10 M⊙ BE sphere with Tkin = 20 K. Frame a shows the minimum value of χ2 (solid lines) and the χ2 value for the reference parameter values (dashed lines). Frame b shows the predicted density and frame c the predicted column density. The cyan, magenta, and red colours correspond, respectively, to the analysis using two, three, or four transitions.
Current usage metrics show cumulative count of Article Views (full-text article views including HTML views, PDF and ePub downloads, according to the available data) and Abstracts Views on Vision4Press platform.
Data correspond to usage on the plateform after 2015. The current usage metrics is available 48-96 hours after online publication and is updated daily on week days.
Initial download of the metrics may take a while.