Fig. 8
Download original image
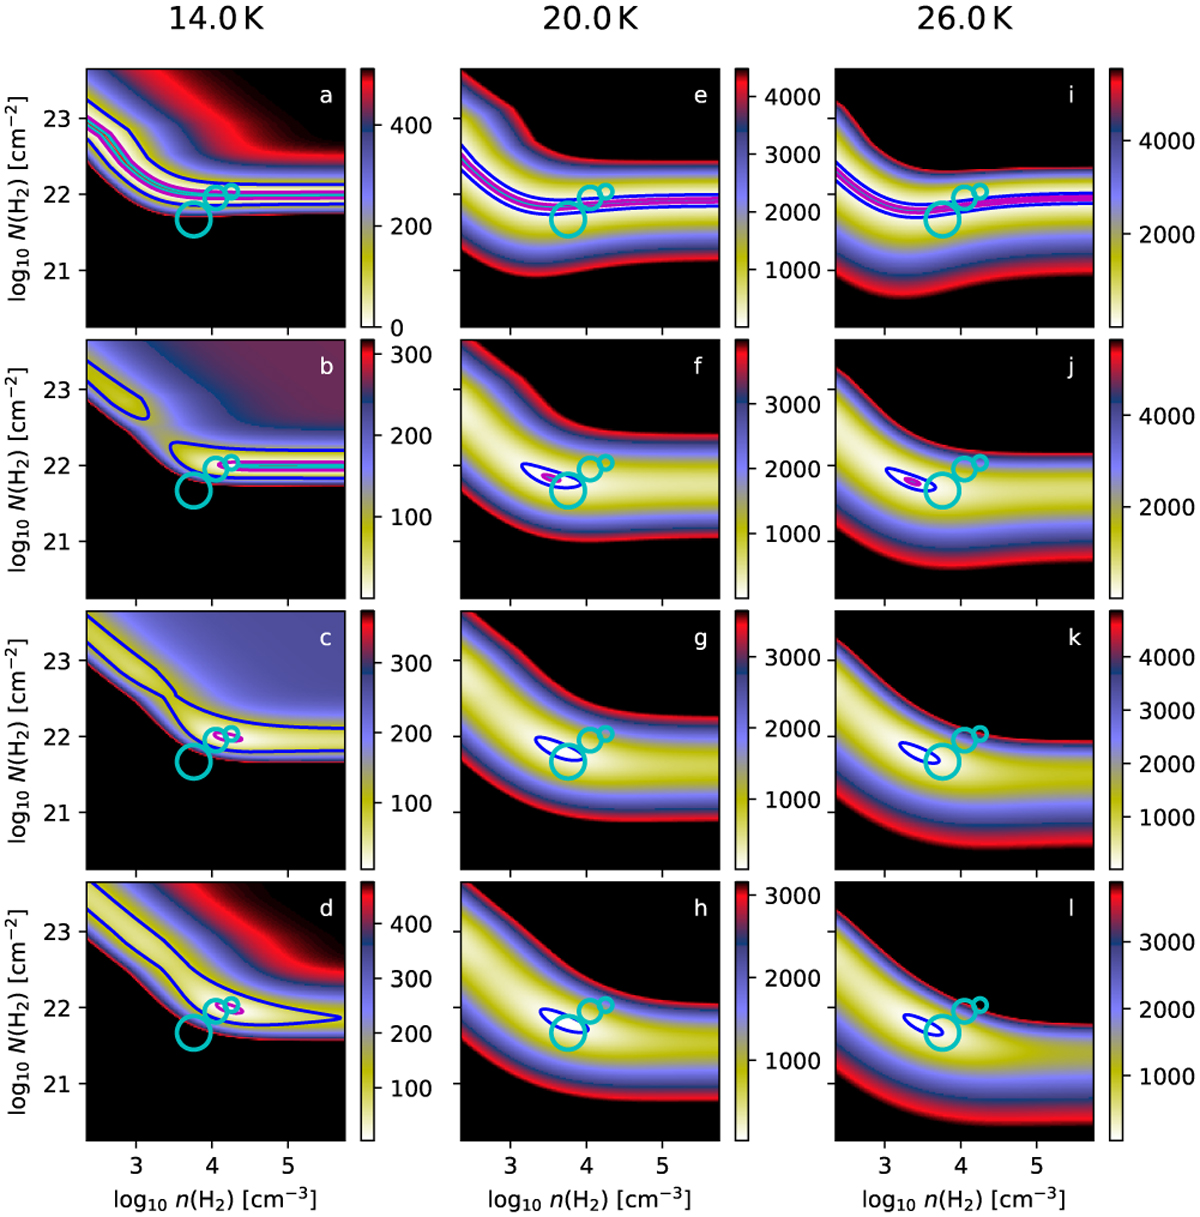
Plots of χ2 in the EPF analysis of 13CO lines. The analysis used three Tkin temperatures, as listed above each column of frames. The cloud model is an isothermal BE sphere with M = 10 M⊙ and Tkin = 20 K. First row shows the analysis of the J = 1 − 0 lines, and each subsequent row adds one further rotational transition. The contours are drawn at χ2 levels of 1 (red), 2 (cyan), 10 (magenta), and 100 (blue contour). In order of increasing size, the circles indicate the reference density and column density values towards the model centre, averaged over a FWHM = R0/3 beam (used for the synthetic observations), and averaged over a FWHM = R0 beam.
Current usage metrics show cumulative count of Article Views (full-text article views including HTML views, PDF and ePub downloads, according to the available data) and Abstracts Views on Vision4Press platform.
Data correspond to usage on the plateform after 2015. The current usage metrics is available 48-96 hours after online publication and is updated daily on week days.
Initial download of the metrics may take a while.