Fig. 6
Download original image
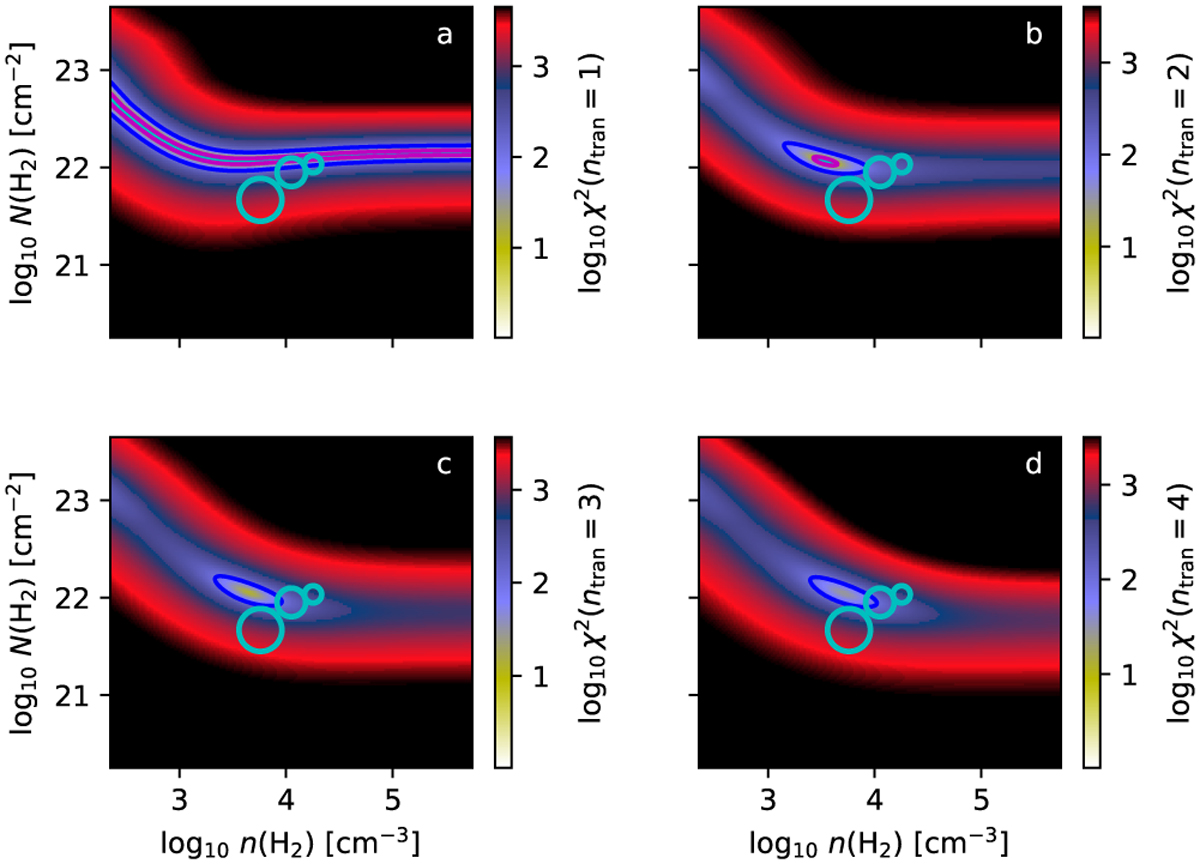
Combined χ2 values in PEP analysis of 13CO spectra. The cloud model an isothermal BE sphere with M = 10 M⊙ and Tkin = 20 K. The frames a-d correspond, respectively, to the combinations of the 1–4 first rotational transitions. The circles indicate the reference values towards its centre (smallest circle), averaged over a FWHM = R0/3 beam (middle circle that corresponds to the synthetic observations), and averaged over a FWHM = R0 beam (largest circle).
Current usage metrics show cumulative count of Article Views (full-text article views including HTML views, PDF and ePub downloads, according to the available data) and Abstracts Views on Vision4Press platform.
Data correspond to usage on the plateform after 2015. The current usage metrics is available 48-96 hours after online publication and is updated daily on week days.
Initial download of the metrics may take a while.