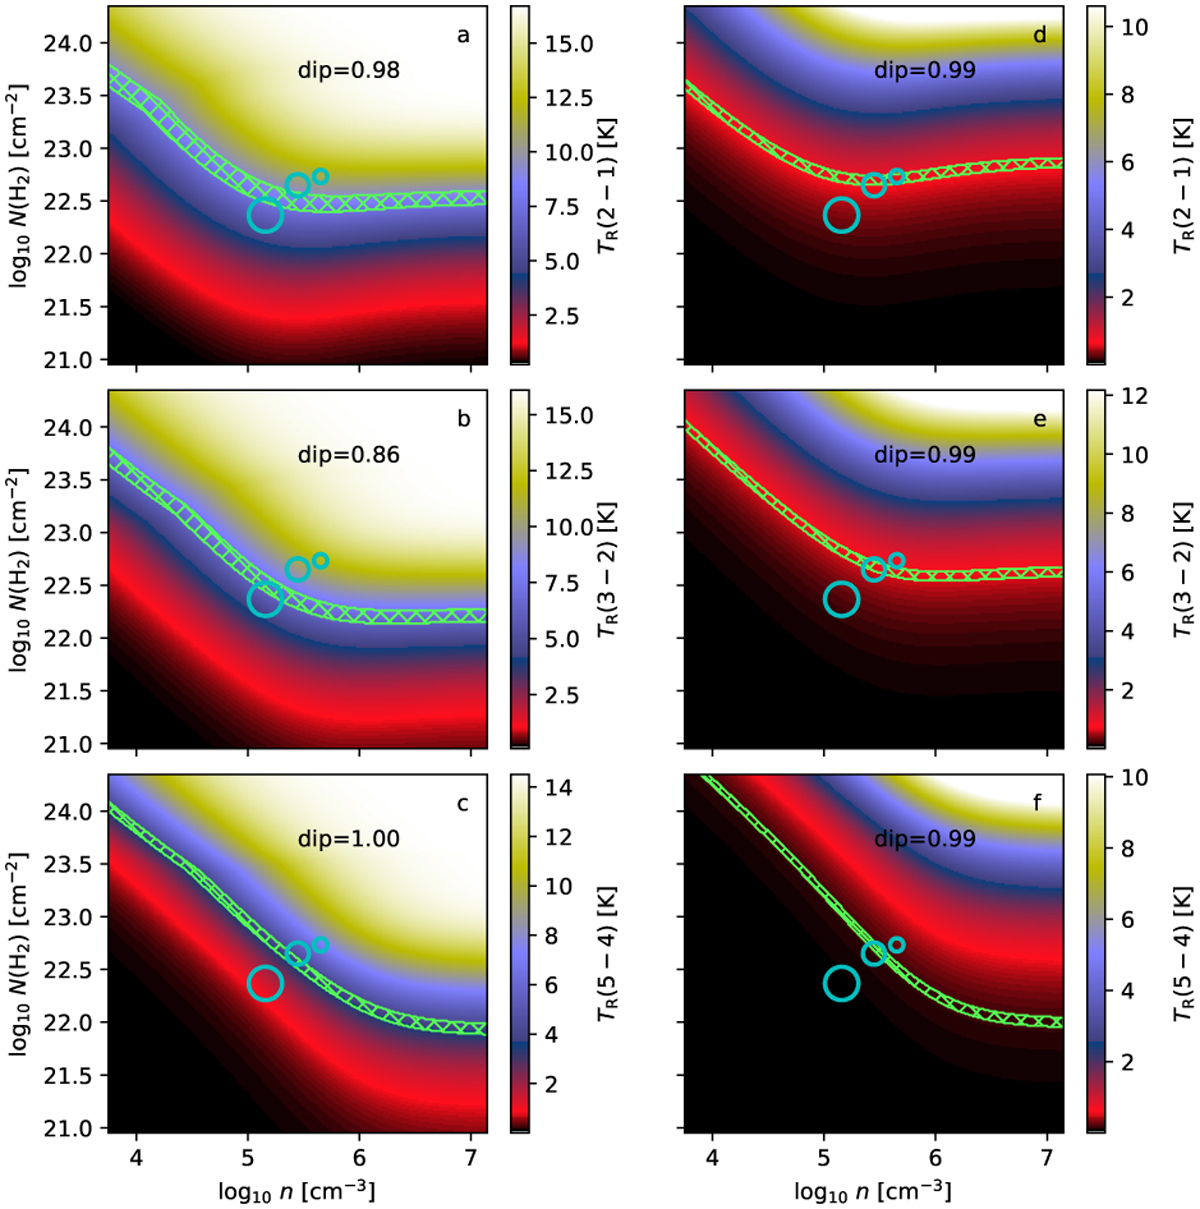
Fig. 5
Download original image
PEP analysis of CS (left frames) and C34S (right) line intensities. The plotted symbols are as in the previous figures. The cloud model is the same as in the previous figures, with M = 2 M⊙ and Tkin = 20 K. Each frame quotes the depth of the possible self-absorption dip as the line intensity at the line centre divided by the maximum intensity.
Current usage metrics show cumulative count of Article Views (full-text article views including HTML views, PDF and ePub downloads, according to the available data) and Abstracts Views on Vision4Press platform.
Data correspond to usage on the plateform after 2015. The current usage metrics is available 48-96 hours after online publication and is updated daily on week days.
Initial download of the metrics may take a while.