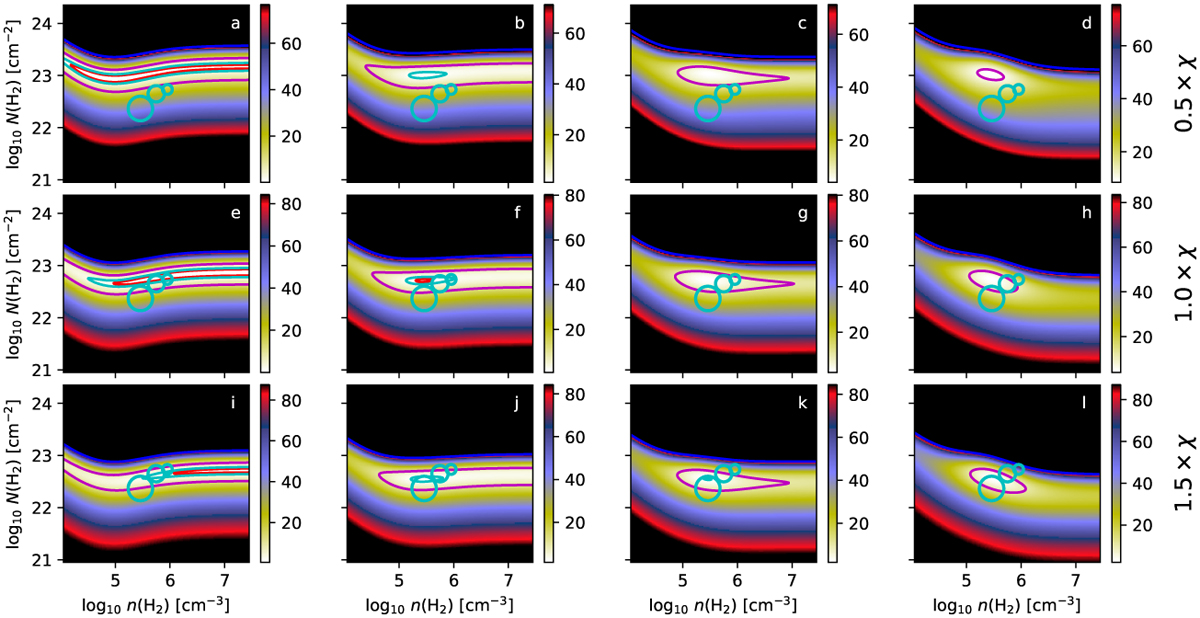
Fig. C.13
Download original image
Results for BE models with M = 0.5 M⊙ and ⟨Tkin⟩=10 K, for Tkin increasing outwards. The frames from left to right correspond to the combination of 1-4 lowest rotation transitions of CS and C34S. The rows correspond to three assumptions of the C34S abundance (middle row with the correct value). Contours are drawn at χ2=1, 2, 10, and 100 (red, cyan, magenta, and blue colours, respectively). The cyan circles indicate the reference values for the central line of sight (smallest circle), for the FWHM = R0/3 beam (as used for the input synthetic observations), and for the FWHM = R0 beam (largest circle).
Current usage metrics show cumulative count of Article Views (full-text article views including HTML views, PDF and ePub downloads, according to the available data) and Abstracts Views on Vision4Press platform.
Data correspond to usage on the plateform after 2015. The current usage metrics is available 48-96 hours after online publication and is updated daily on week days.
Initial download of the metrics may take a while.