Fig. 4
Download original image
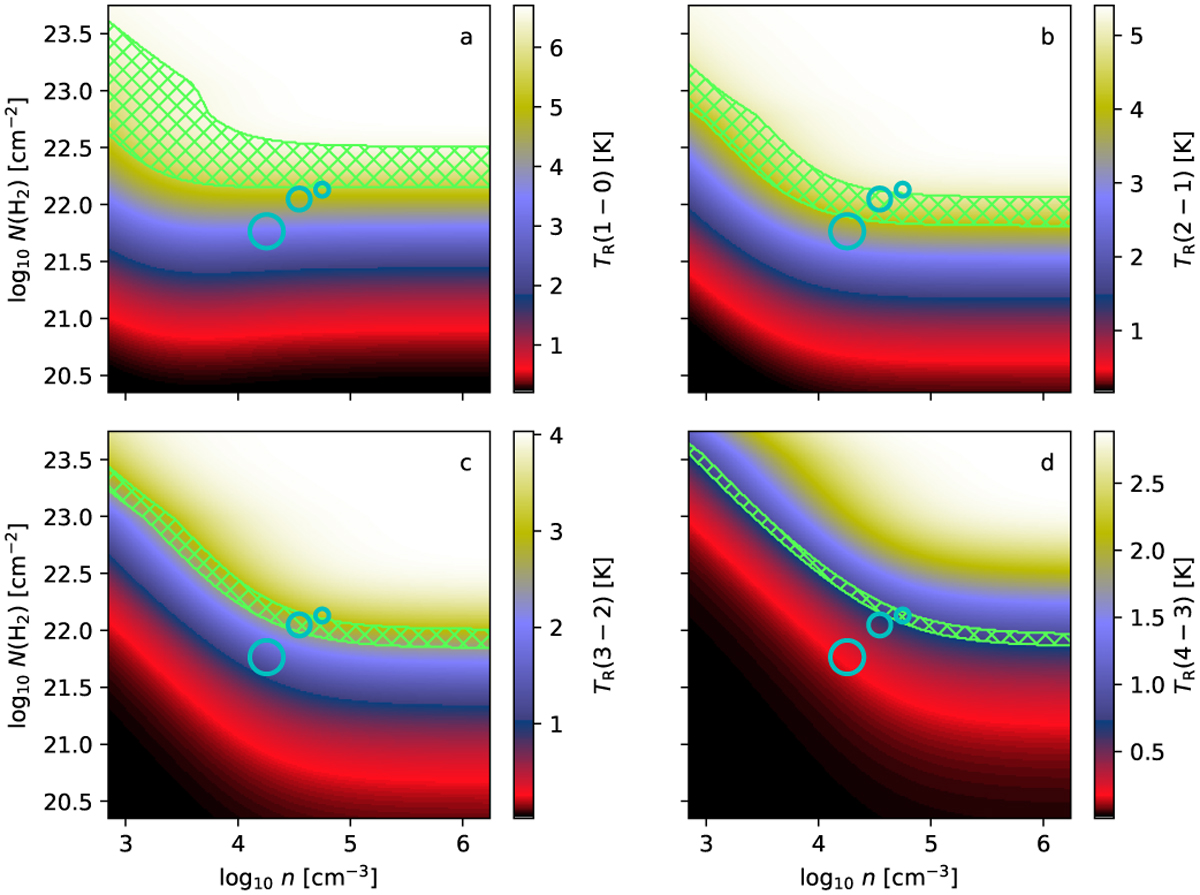
PEP results for 13CO spectra towards a BE sphere with Tkin = 10 K and M = 2 M⊙. The colour scale shows the predicted line intensities as a function of volume and column density. In the green hatched areas PEP predictions are within 10% of the observed line intensities. The circles indicate the reference cloud parameters for the central LOS (small circle), along with the beam average with FWHM = R0/3 (middle circle corresponding to the beam in the synthetic observations) and for FWHM = R0 (large circle).
Current usage metrics show cumulative count of Article Views (full-text article views including HTML views, PDF and ePub downloads, according to the available data) and Abstracts Views on Vision4Press platform.
Data correspond to usage on the plateform after 2015. The current usage metrics is available 48-96 hours after online publication and is updated daily on week days.
Initial download of the metrics may take a while.