Fig. 3

Download original image
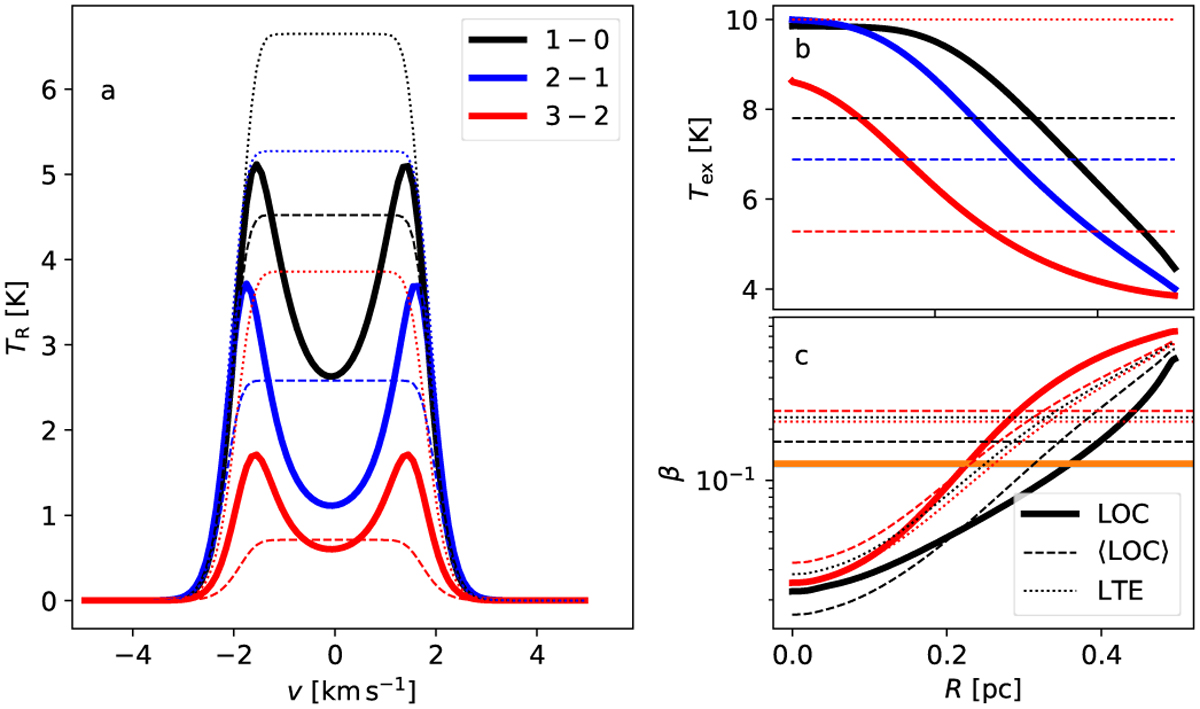
Example of optically thick CO emission from a 10 M⊙ BE model with Tkin = 10 K. Frame a shows spectra, frame b Tex profiles, and frame c the radial variation in the photon escape probability β. Results are shown for full non-LTE calculations with LOC (solid lines), for constant excitation equal to the mean values of the LOC solution (“⟨LOC⟩”, dashed lines), and for the LTE case at Tkin (dotted lines). Frames a–b show data for the first three transitions (black, blue, and red, respectively) but, for clarity, frame c includes only the J = 1–0 and J = 3–2 transitions.
Current usage metrics show cumulative count of Article Views (full-text article views including HTML views, PDF and ePub downloads, according to the available data) and Abstracts Views on Vision4Press platform.
Data correspond to usage on the plateform after 2015. The current usage metrics is available 48-96 hours after online publication and is updated daily on week days.
Initial download of the metrics may take a while.


