Fig. B.1
Download original image
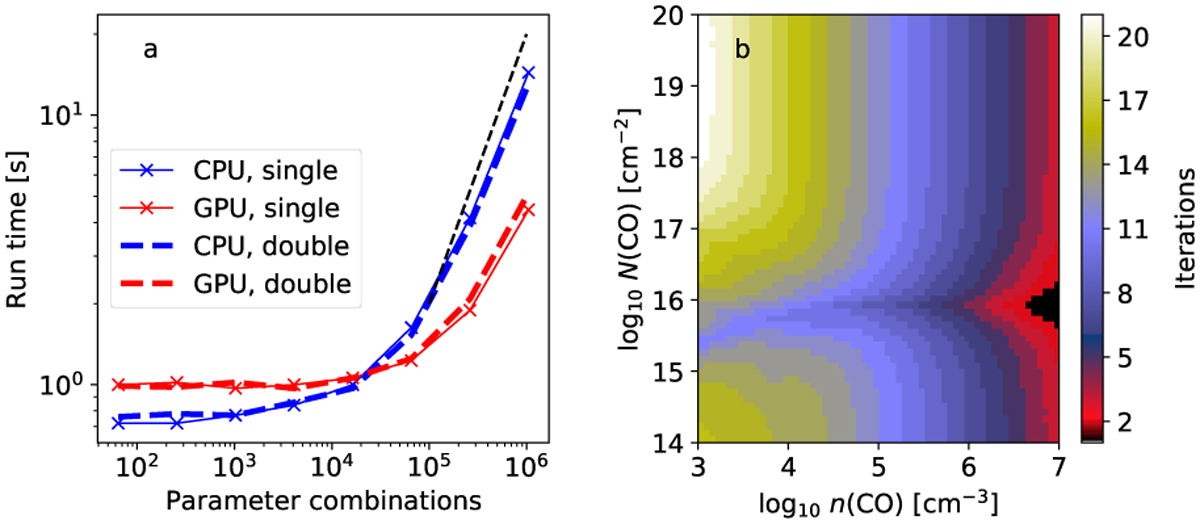
Examples of PEP run times. Frame a shows the run time on CPU (blue curve) and GPU (red curve) as a function of the number of parameter combinations (n, N) for Tkin=15 K. The calculations included the first 20 rotational levels of the CO molecule. The black dashed line indicates the slope of a one-to-one relation. Frame b shows how the number of iterations needed to reach the selected convergence criteria.
Current usage metrics show cumulative count of Article Views (full-text article views including HTML views, PDF and ePub downloads, according to the available data) and Abstracts Views on Vision4Press platform.
Data correspond to usage on the plateform after 2015. The current usage metrics is available 48-96 hours after online publication and is updated daily on week days.
Initial download of the metrics may take a while.