Fig. 23
Download original image
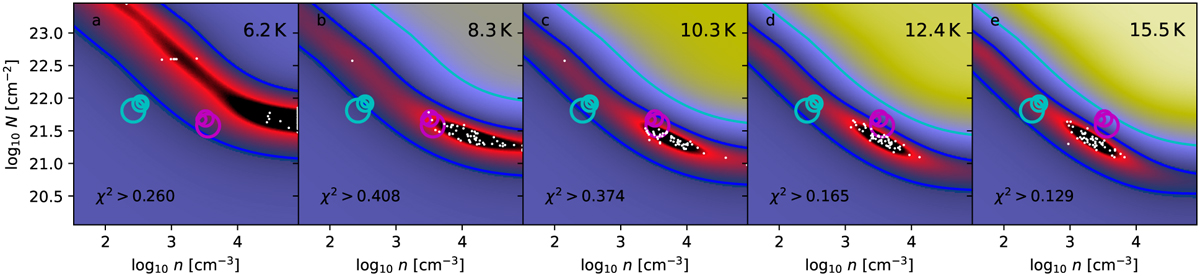
EPF analysis of the first three 13CO transitions observed from an MHD clump. Results are shown for five Tkin values around the reference value Tref. The images show the χ2 planes for noiseless observations but assuming 20% error estimates. The contours are drawn at χ2 = 1 (blue contour) and χ2 = 2 (cyan contour). The minimum χ2 values (average over the three transitions) are quoted in the frames. The white dots correspond to the χ2 minima for 50 noise realisations consistent with the 20% observational noise.
Current usage metrics show cumulative count of Article Views (full-text article views including HTML views, PDF and ePub downloads, according to the available data) and Abstracts Views on Vision4Press platform.
Data correspond to usage on the plateform after 2015. The current usage metrics is available 48-96 hours after online publication and is updated daily on week days.
Initial download of the metrics may take a while.