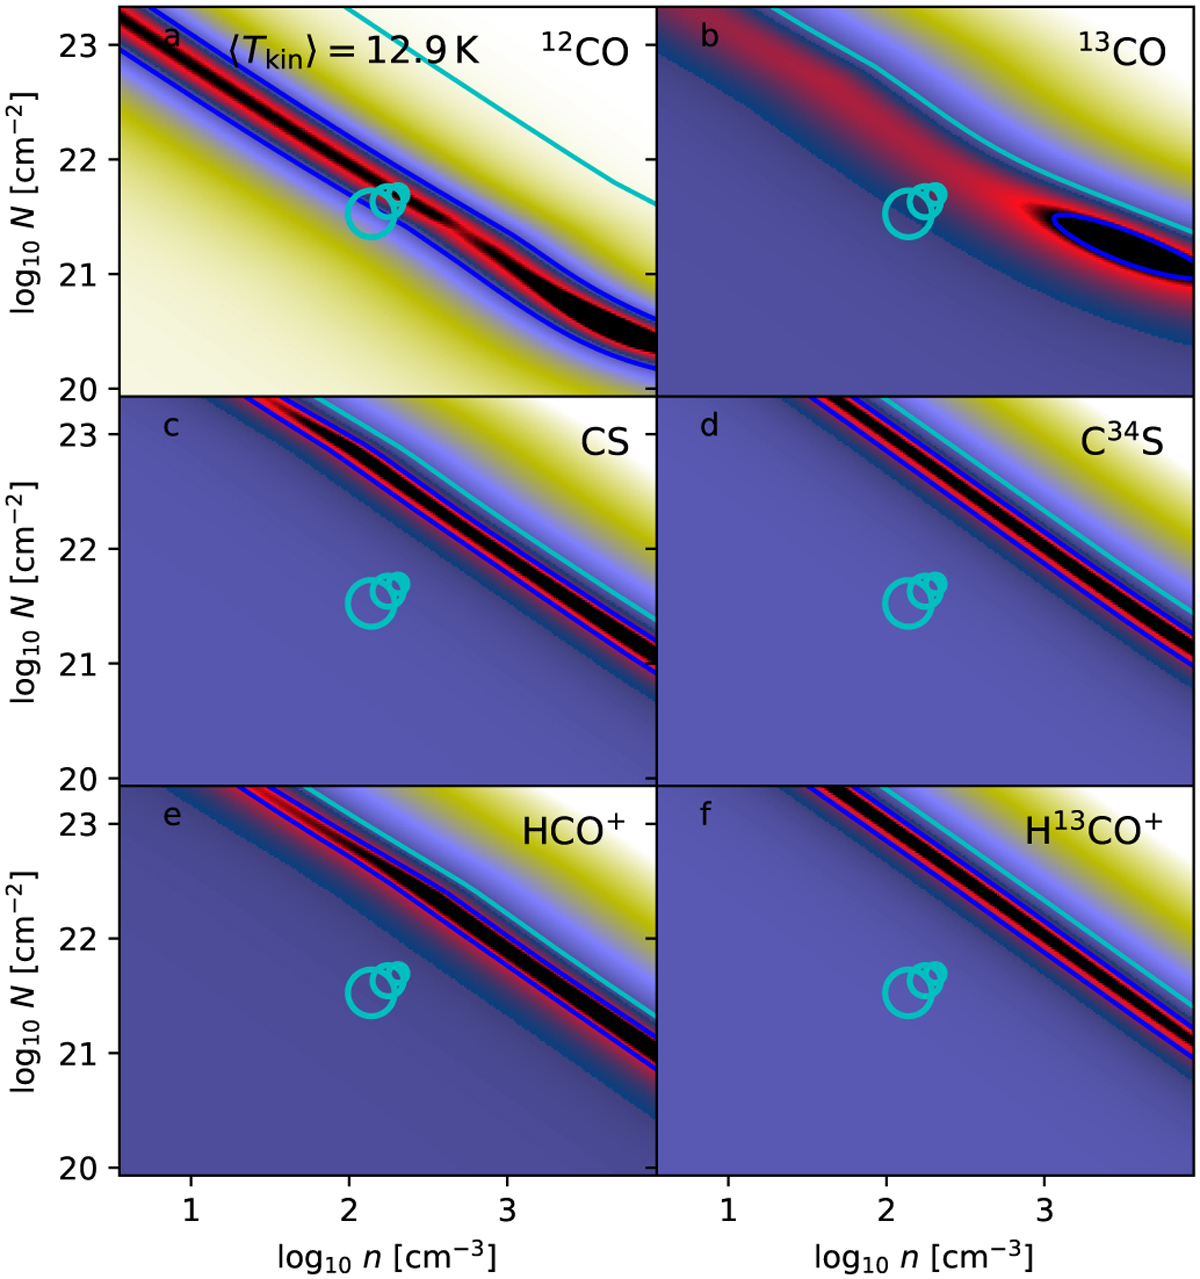
Fig. 18
Download original image
PEP results for a MHD clump, using the Tkin value given in frame a. Each frame shows χ2 for one molecule and its first three rotational transitions. The cyan circles indicate the beam-averaged model mean densities and column densities (sizes in order of increasing FWHM). The χ2 values are based on the medium beam size. The blue, cyan, magenta, and red contours correspond to χ2 = 1, 2, 10, and 100.
Current usage metrics show cumulative count of Article Views (full-text article views including HTML views, PDF and ePub downloads, according to the available data) and Abstracts Views on Vision4Press platform.
Data correspond to usage on the plateform after 2015. The current usage metrics is available 48-96 hours after online publication and is updated daily on week days.
Initial download of the metrics may take a while.