Open Access
Fig. 17
Download original image
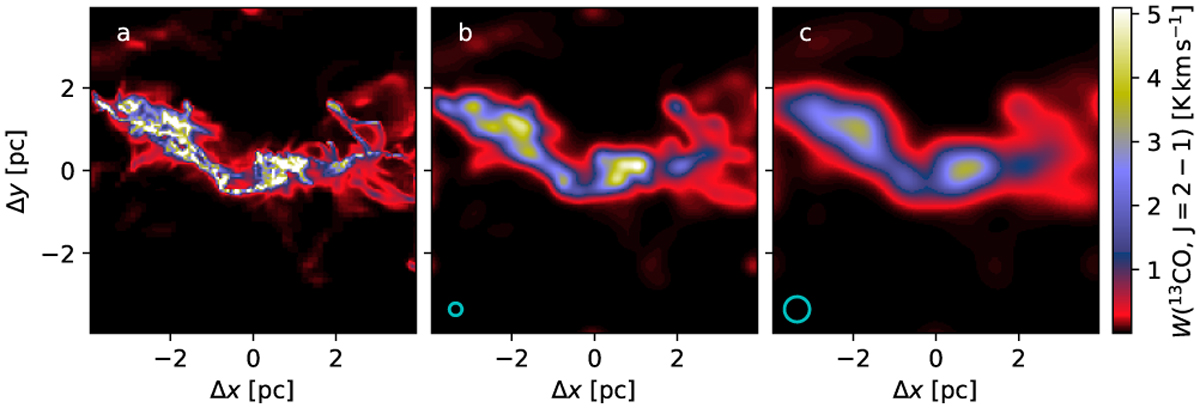
Example of a clump extracted from the MHD model. The frames show the 13CO(2-1) line-area maps at the full resolution (frame a) and for observations with FWHM = 0.31 pc (frame b) and FWHM = 0.61 pc (frame c) beam sizes. The fractional abundance is spatially constant.
Current usage metrics show cumulative count of Article Views (full-text article views including HTML views, PDF and ePub downloads, according to the available data) and Abstracts Views on Vision4Press platform.
Data correspond to usage on the plateform after 2015. The current usage metrics is available 48-96 hours after online publication and is updated daily on week days.
Initial download of the metrics may take a while.