Fig. 9
Download original image
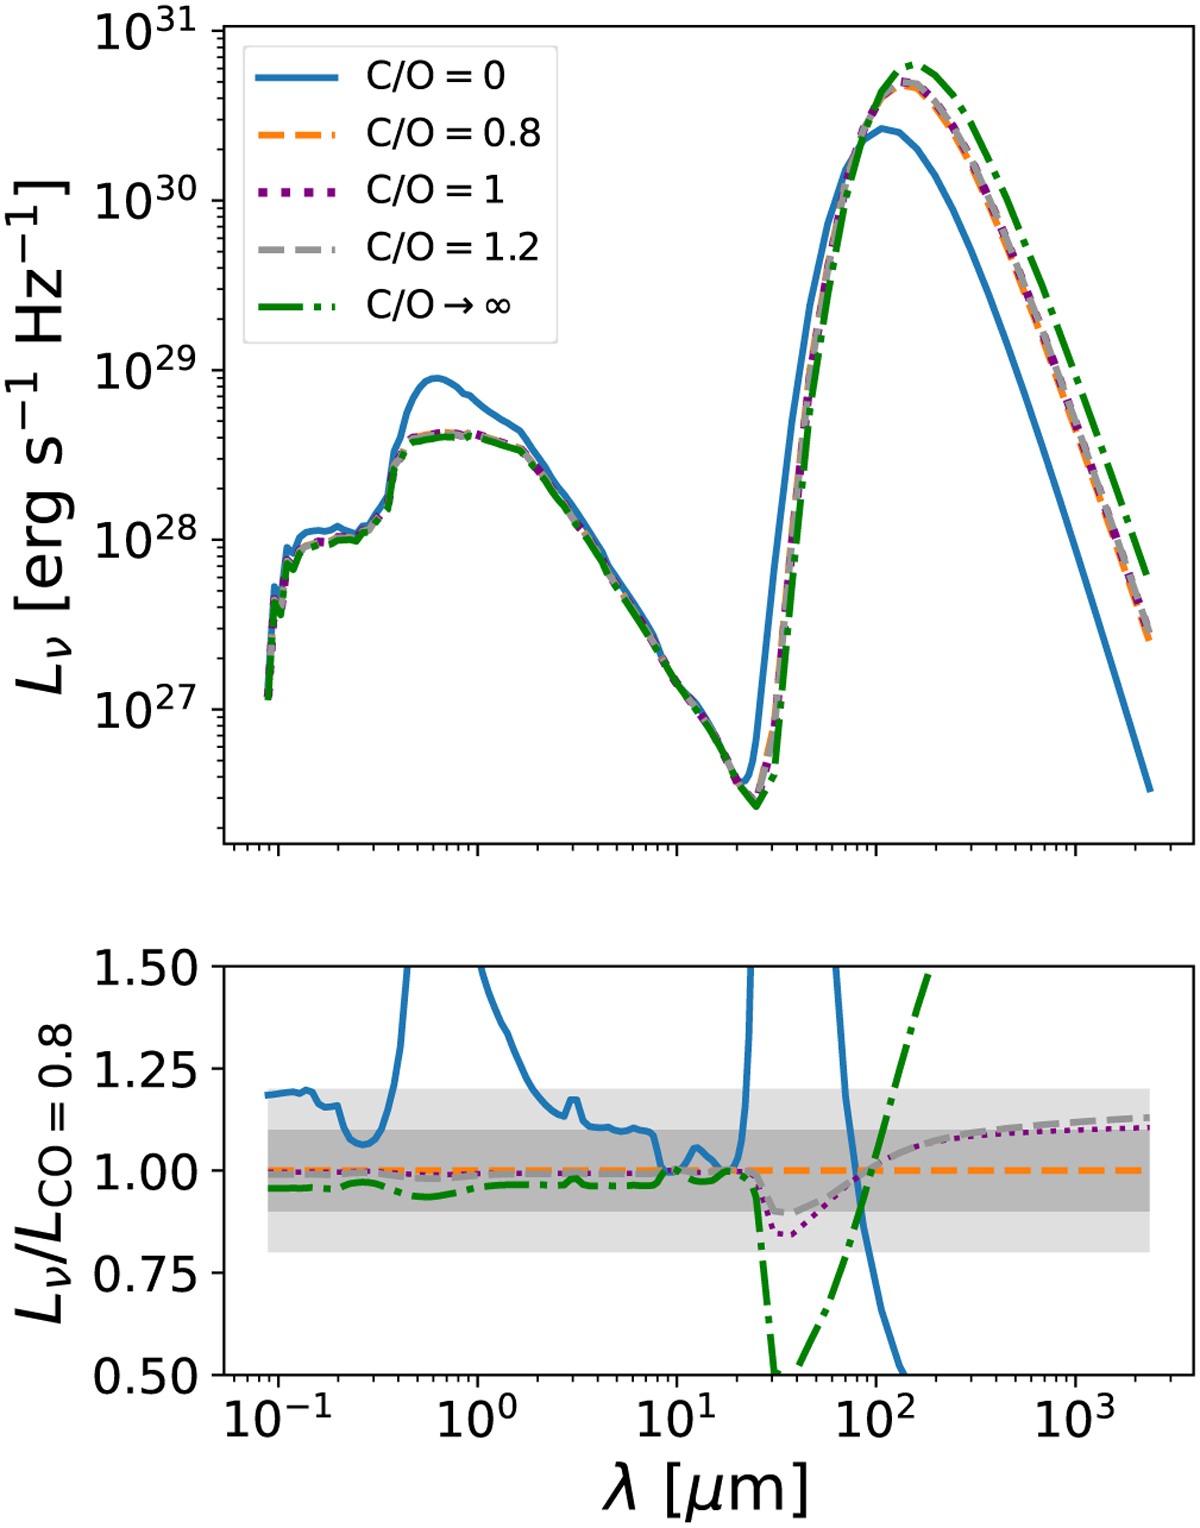
Results from the baseline analysis for run 13 (orange dashed), compared to the results from the other studied dust compositions: C/O ~ 0 (blue solid), C/O ~ 1 (purple dotted), C/O ~ 1.2 (gray dashed), and C/O → ∞ (black dotted-dashed). Top: SED predictions as a function of the relative abundance of silicate and carbonaceous grains. Bottom: Ratios between the SED of each studied case and the baseline (C/O ~ 0.8), with the light and dark gray bands showing a 10% and 20% difference, respectively.
Current usage metrics show cumulative count of Article Views (full-text article views including HTML views, PDF and ePub downloads, according to the available data) and Abstracts Views on Vision4Press platform.
Data correspond to usage on the plateform after 2015. The current usage metrics is available 48-96 hours after online publication and is updated daily on week days.
Initial download of the metrics may take a while.