Fig. A.1
Download original image
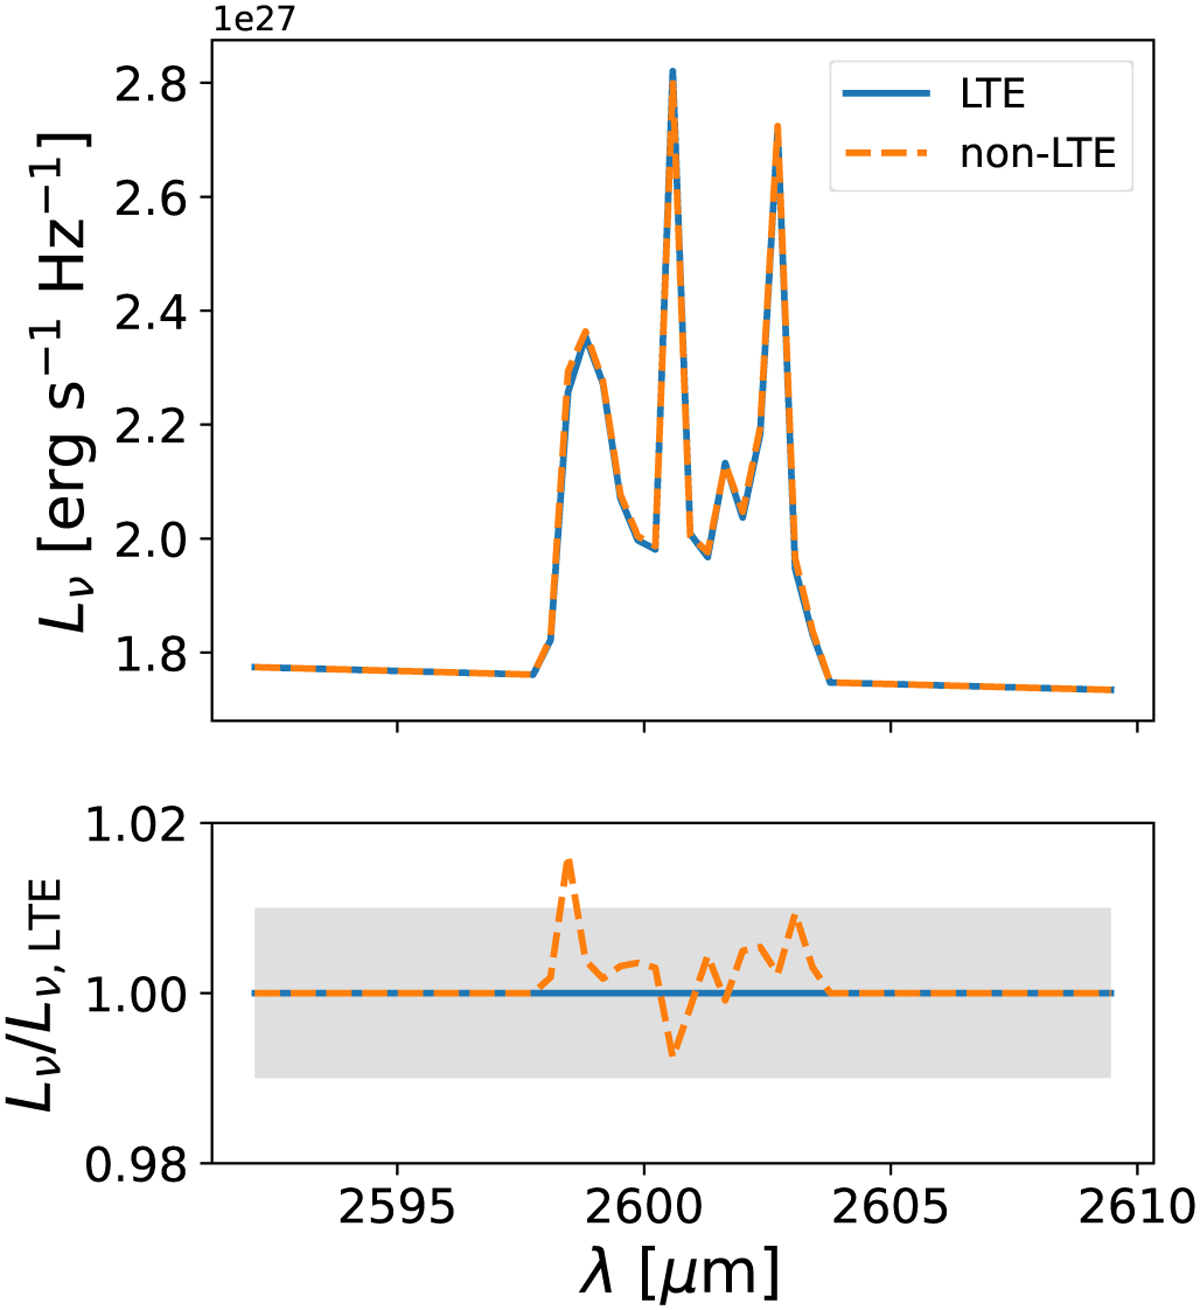
CO(1–0) line spectra for run 13, obtained projecting the galaxy edge-on. The top panel shows the comparison between the spectrum obtained in LTE approximation (blue solid) and the one obtained adopting the non-LTE method (orange dashed). The bottom panel displays the wavelength-wise ratio between the spectra, highlighting that the difference is ≲1% in almost all bins.
Current usage metrics show cumulative count of Article Views (full-text article views including HTML views, PDF and ePub downloads, according to the available data) and Abstracts Views on Vision4Press platform.
Data correspond to usage on the plateform after 2015. The current usage metrics is available 48-96 hours after online publication and is updated daily on week days.
Initial download of the metrics may take a while.