Fig. 21
Download original image
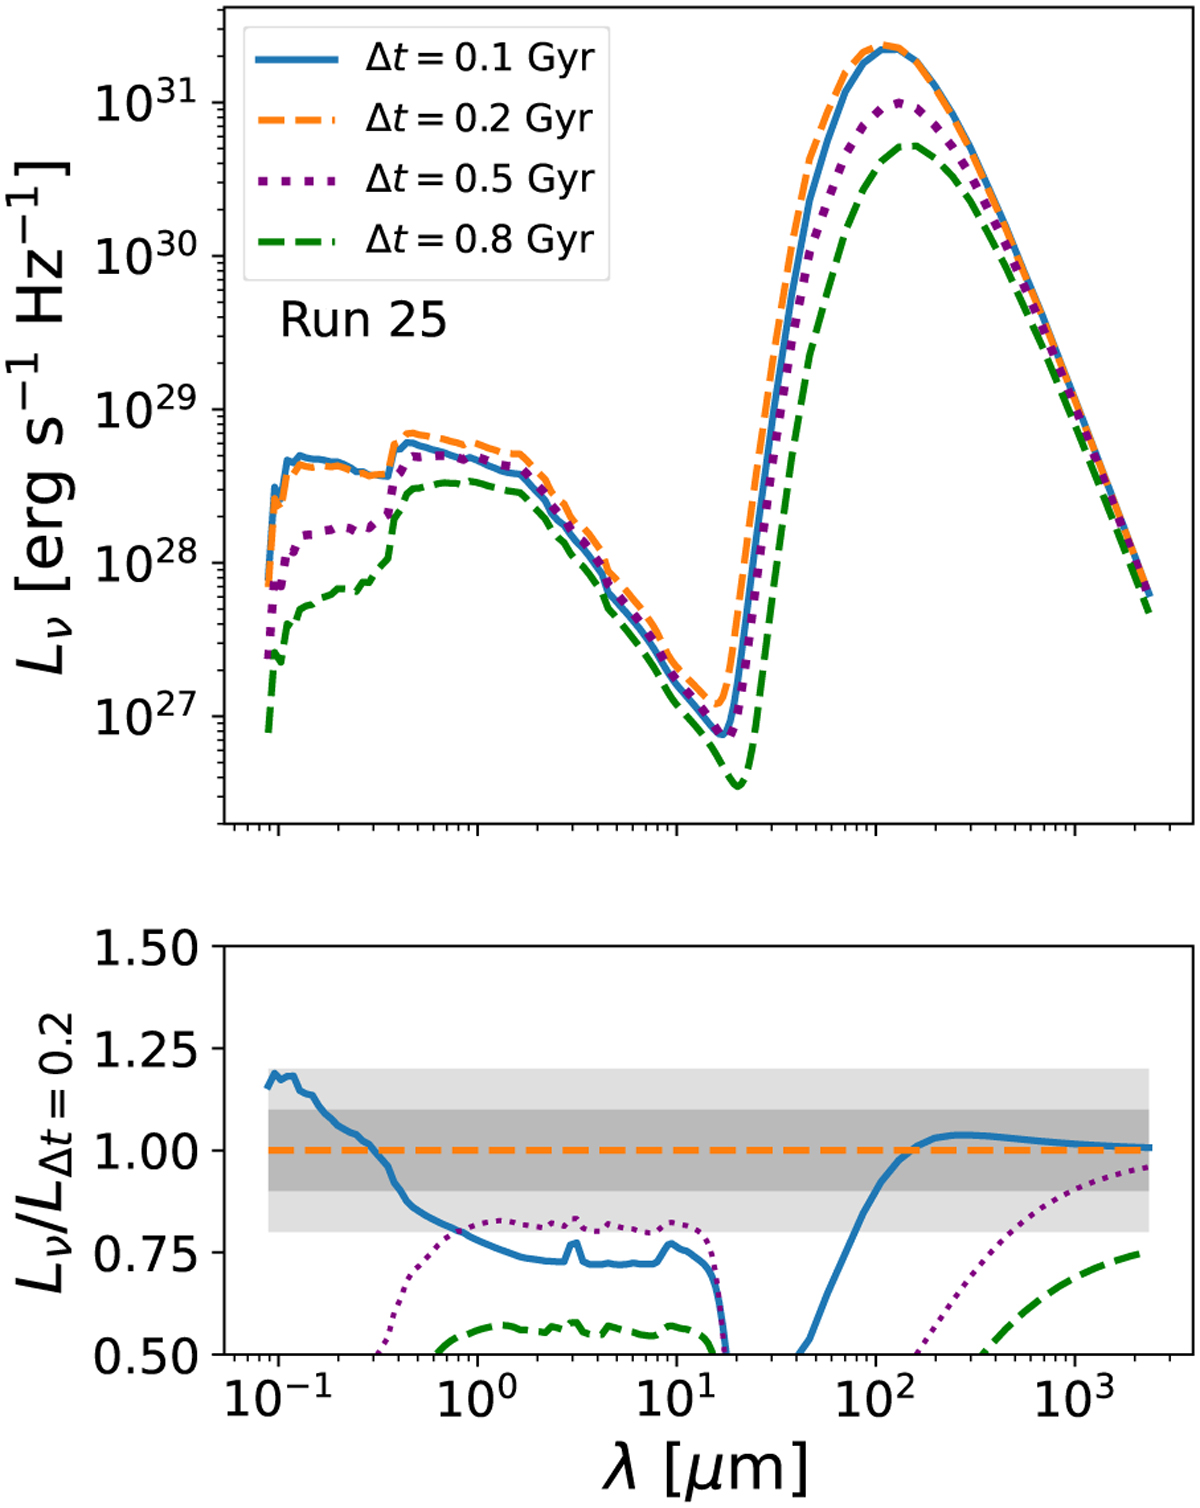
Top: Comparison of the SED predictions for run 25 at different time snapshots, ∆t = 0.1 Gyr (blue solid), ∆t = 0.2 Gyr (orange dashed), ∆t = 0.5 Gyr (purple dotted), and ∆t = 0.8 Gyr (green dotted- dashed) after the end of the relaxation phase, respectively. Bottom: Ratios between the SED of each studied case and the baseline (∆t = 0.2 Gyr).
Current usage metrics show cumulative count of Article Views (full-text article views including HTML views, PDF and ePub downloads, according to the available data) and Abstracts Views on Vision4Press platform.
Data correspond to usage on the plateform after 2015. The current usage metrics is available 48-96 hours after online publication and is updated daily on week days.
Initial download of the metrics may take a while.