Open Access
Fig. 2
Download original image
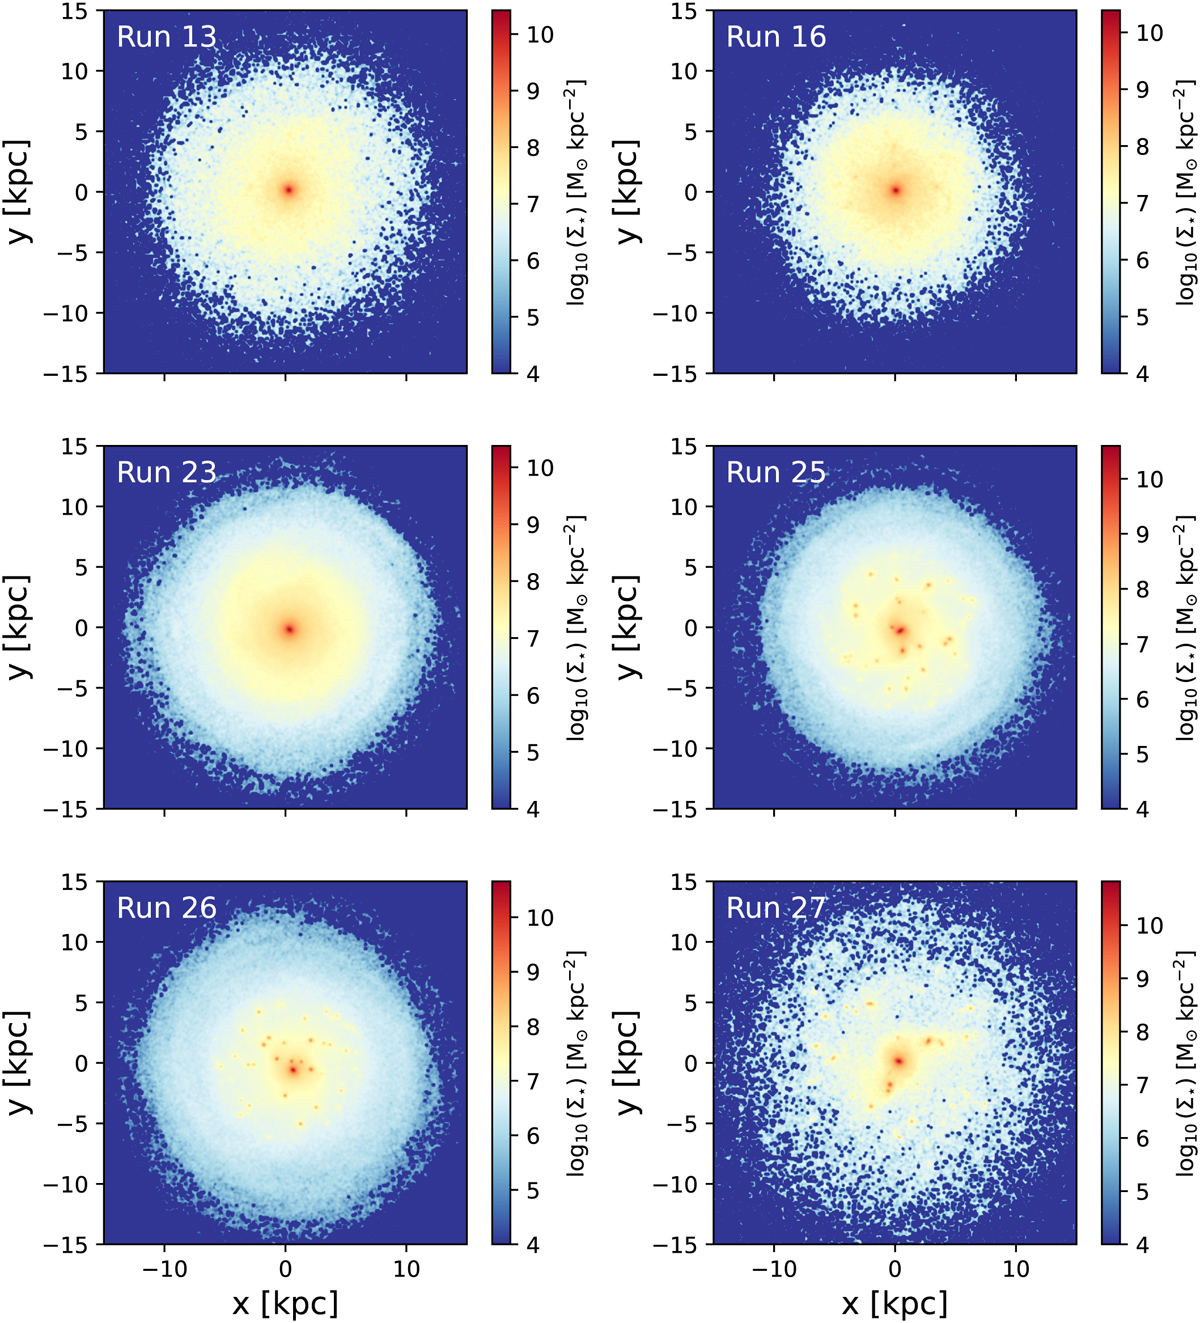
Stellar mass surface density maps, viewed face-on, for the six different runs analyzed in this paper, after ∆t = 0.2 Gyr from the end of the relaxation phase. The run each projection refers to is reported inside the corresponding panel.
Current usage metrics show cumulative count of Article Views (full-text article views including HTML views, PDF and ePub downloads, according to the available data) and Abstracts Views on Vision4Press platform.
Data correspond to usage on the plateform after 2015. The current usage metrics is available 48-96 hours after online publication and is updated daily on week days.
Initial download of the metrics may take a while.