Open Access
Fig. 17
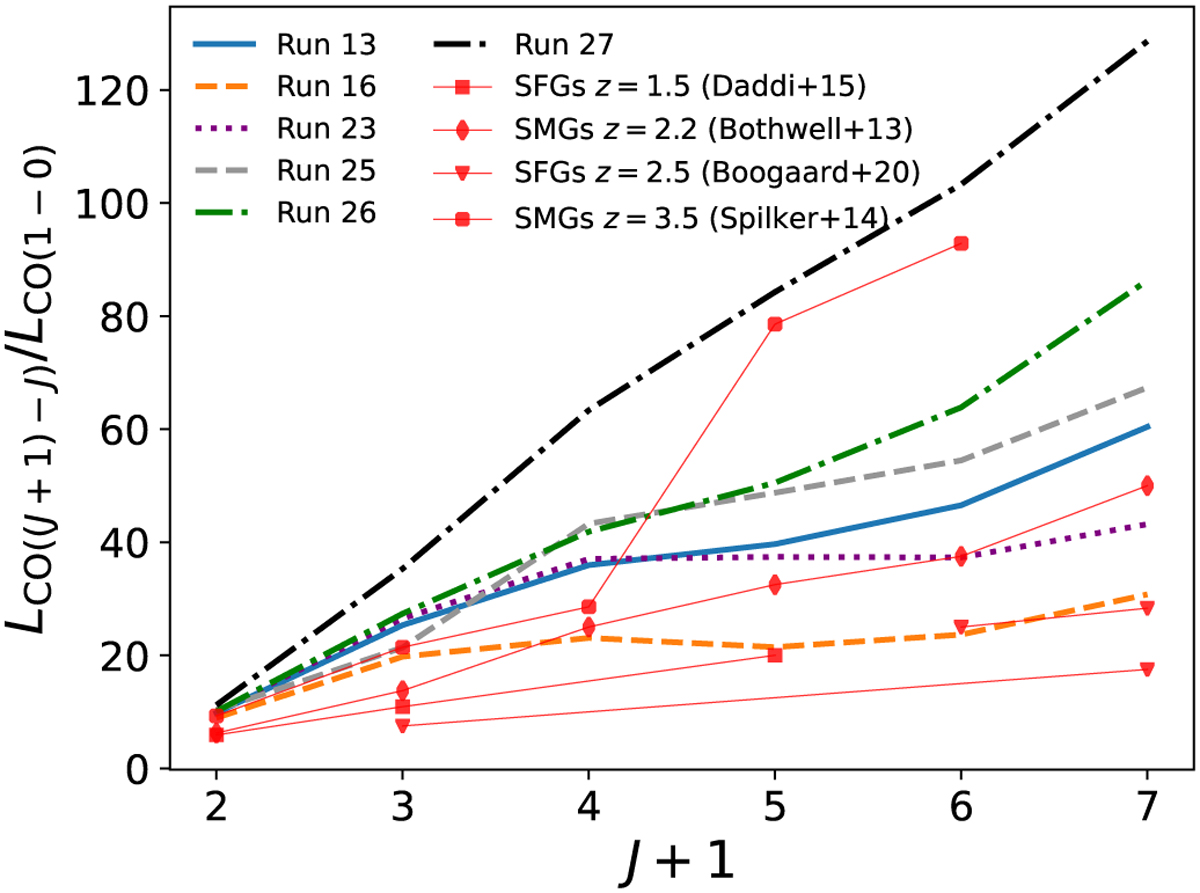
Download original image
CO SLED for the baseline analysis of the six simulations studied in this work, after ∆t = 0.2 Gyr from the end of the relaxation phase. The thin red lines display the literature results for different galaxies at cosmic noon.
Current usage metrics show cumulative count of Article Views (full-text article views including HTML views, PDF and ePub downloads, according to the available data) and Abstracts Views on Vision4Press platform.
Data correspond to usage on the plateform after 2015. The current usage metrics is available 48-96 hours after online publication and is updated daily on week days.
Initial download of the metrics may take a while.