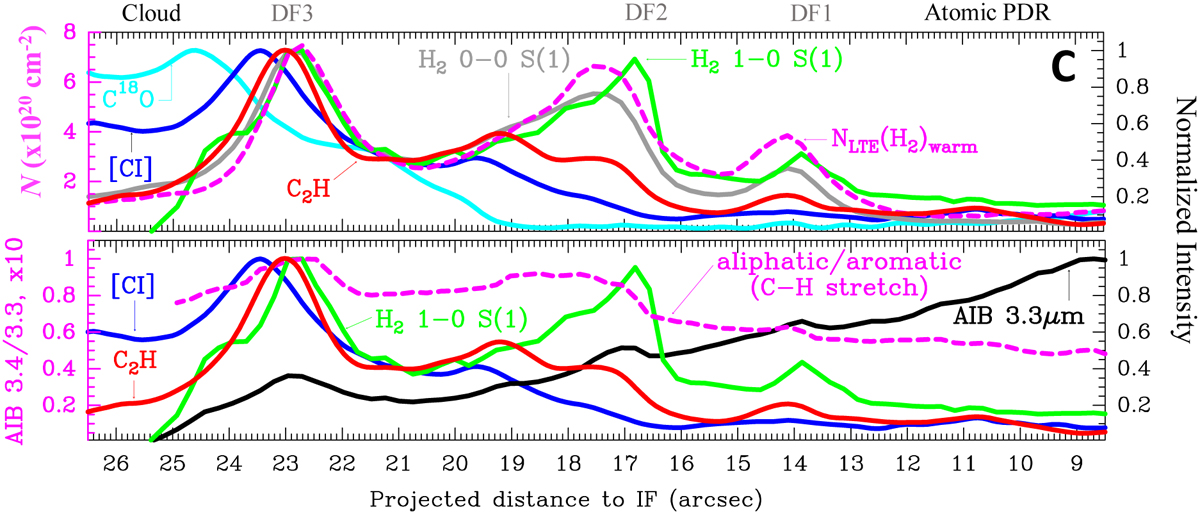
Fig. 7
Download original image
Vertically averaged crosscut C with Δ(δy) = 2′′. This cut passes through the green cross in Fig 6. In the upper panel, the magenta dashed curve shows the column density of warm H2 obtained from v = 0–0 S (4) and S (2) lines, observed with MIRI-MRS, assuming a Boltzmann distribution at T64(≃ 600 K, shown in Fig. C.5). In the bottom panel, the magenta dashed curve shows the 3.4/3.3 μm AIB intensity ratio (×10).
Current usage metrics show cumulative count of Article Views (full-text article views including HTML views, PDF and ePub downloads, according to the available data) and Abstracts Views on Vision4Press platform.
Data correspond to usage on the plateform after 2015. The current usage metrics is available 48-96 hours after online publication and is updated daily on week days.
Initial download of the metrics may take a while.