Fig. 6
Download original image
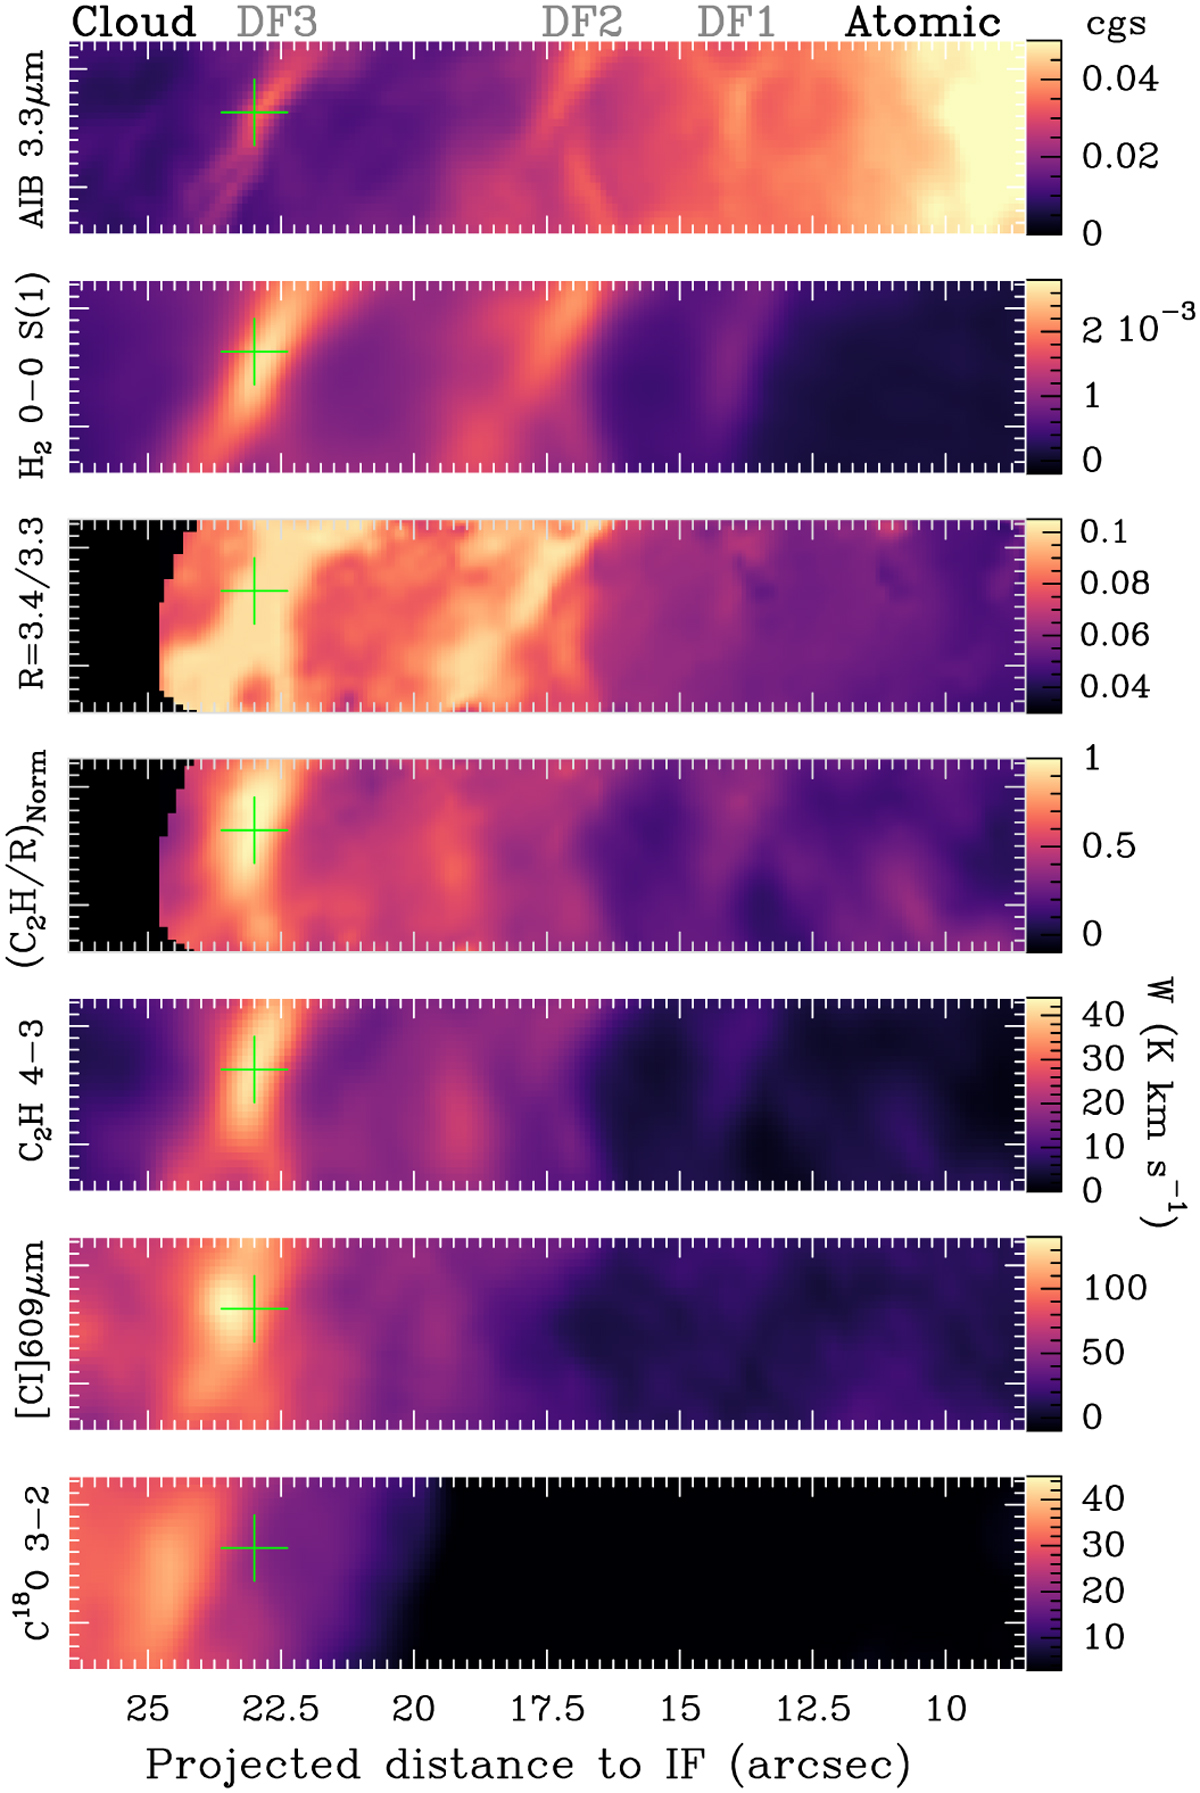
Small FoV observed with NIRSpec and MIRI-MRS. The green cross shows a C2H N = 4–3 emission peak in DF3 region. This peak nearly coincides with the IR H2 emission peak. “cgs” refers to erg s−1 cm−2 sr−1. The (C2H/R)Norm map refers to the normalized C2H N = 4–3 line intensity divided by the normalized 3.4/3.3 μm AIB ratio. Figure 7 shows vertically averaged intensity cuts of this field.
Current usage metrics show cumulative count of Article Views (full-text article views including HTML views, PDF and ePub downloads, according to the available data) and Abstracts Views on Vision4Press platform.
Data correspond to usage on the plateform after 2015. The current usage metrics is available 48-96 hours after online publication and is updated daily on week days.
Initial download of the metrics may take a while.