Fig. 4
Download original image
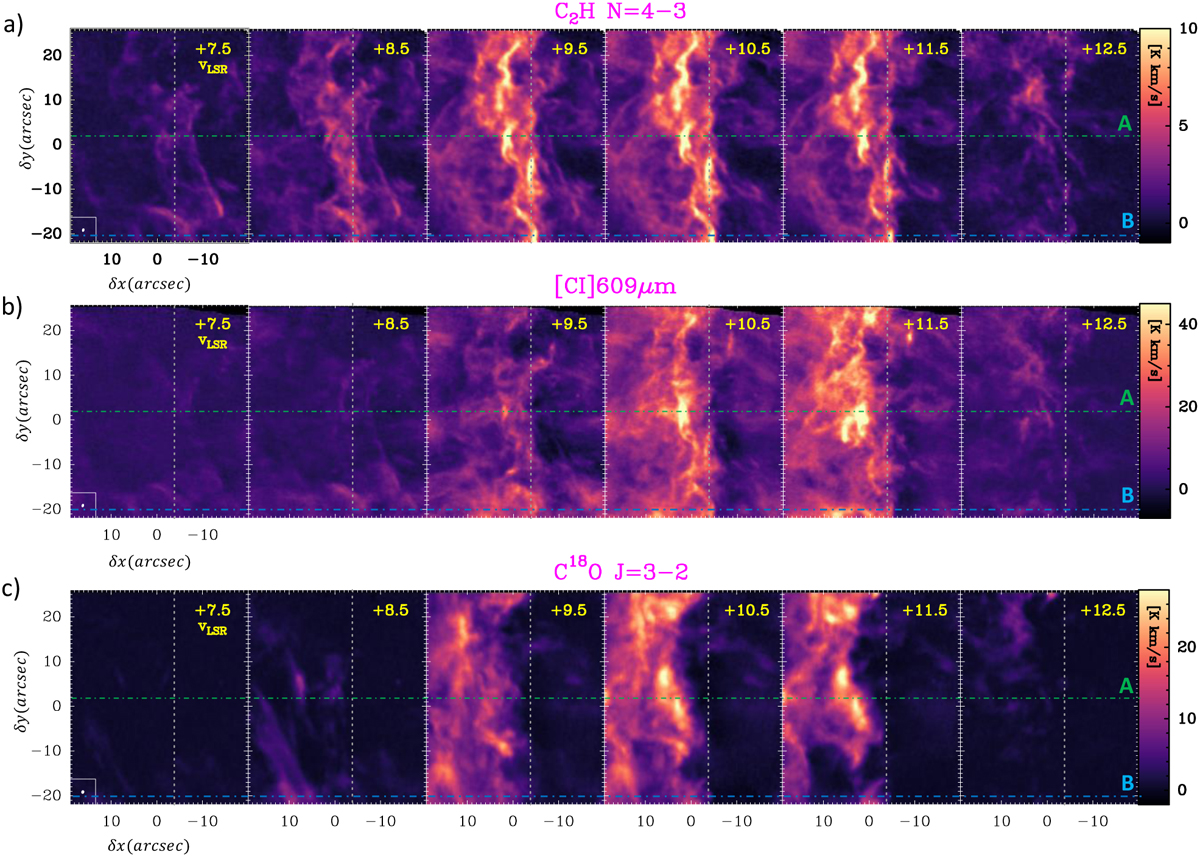
ALMA velocity channel maps of the Bar from vLSR = +7 to +12.5 km s−1 in bins of 1 km s−1. All images have been rotated to bring the FUV-illuminating direction into the horizontal direction (from the right). The synthesized beam of each mosaic is indicated in the bottom-left corner of the first panel. The vertical dashed white line crosses DF2 (δx ≃−4′′) and marks the approximate position of the main H2 DFs parallel to the Bar. The horizontal lines show the position of the vertically averaged cuts A and B, parallel to the incoming FUV, discussed in the text.
Current usage metrics show cumulative count of Article Views (full-text article views including HTML views, PDF and ePub downloads, according to the available data) and Abstracts Views on Vision4Press platform.
Data correspond to usage on the plateform after 2015. The current usage metrics is available 48-96 hours after online publication and is updated daily on week days.
Initial download of the metrics may take a while.