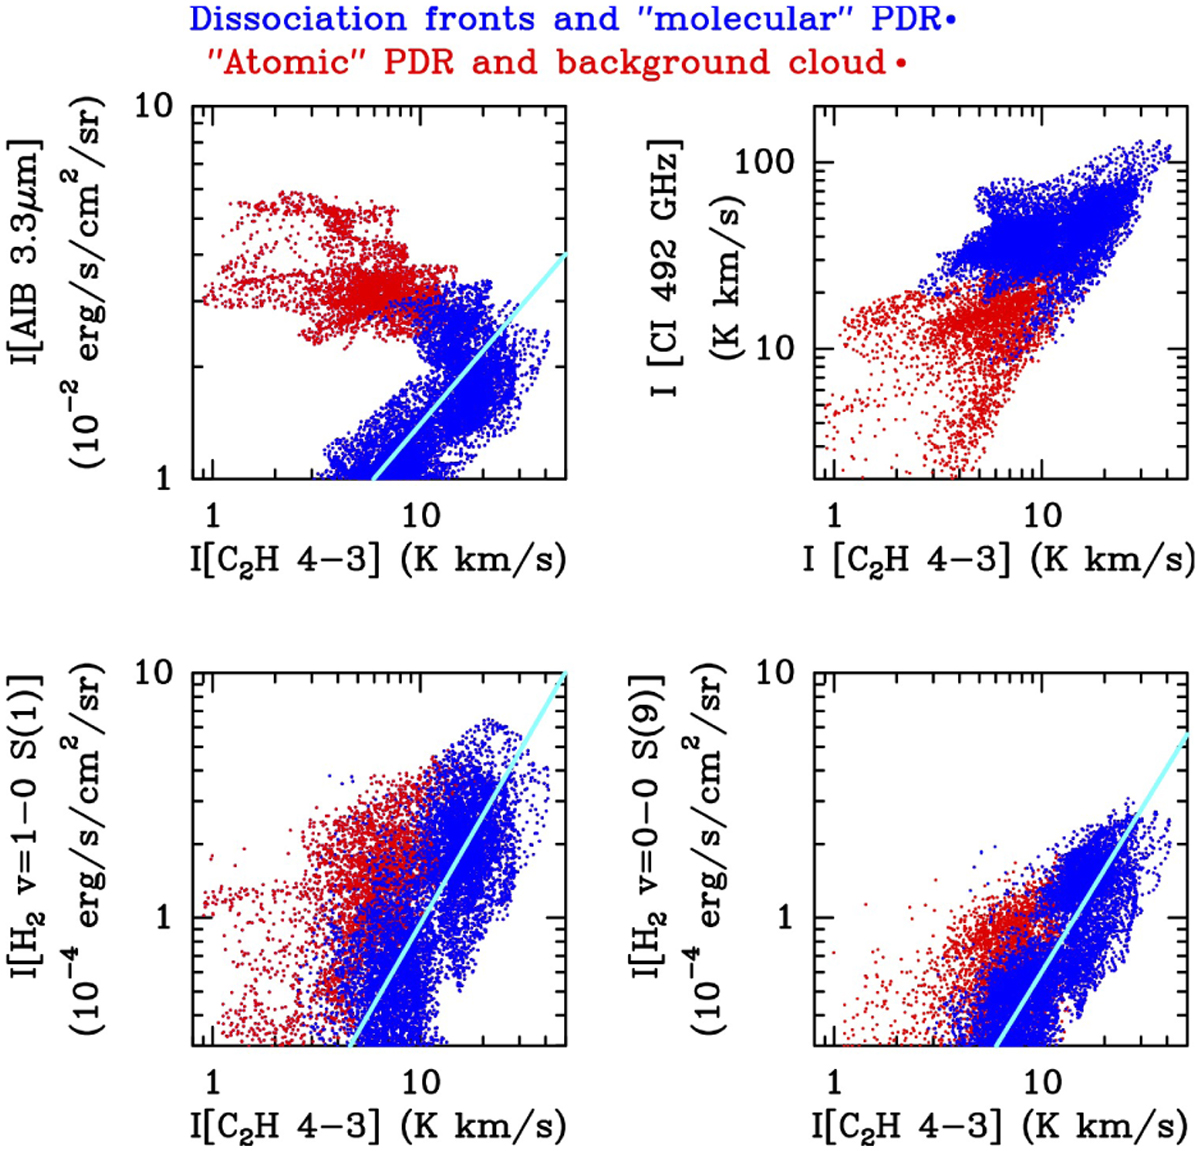
Fig. D.1
Download original image
Intensity correlation plots of C2H N = 4–3. Blueish pixels correspond to emission at δx > −5′′ (main DFs and molecular PDR) whereas reddish pixels correspond to emission at δx < −5′′ (atomic PDR and background OMC-1 cloud). The straight cyan lines are regression curves, with parameters of Table D.1, obtained by fitting the bluish areas only.
Current usage metrics show cumulative count of Article Views (full-text article views including HTML views, PDF and ePub downloads, according to the available data) and Abstracts Views on Vision4Press platform.
Data correspond to usage on the plateform after 2015. The current usage metrics is available 48-96 hours after online publication and is updated daily on week days.
Initial download of the metrics may take a while.