Open Access
Fig. C.5
Download original image
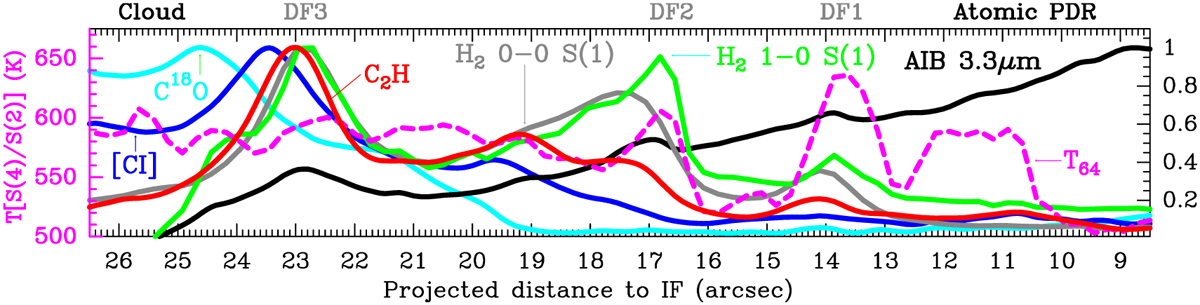
Crosscut C: Vertically averaged intensity ratio with Δ(δy) = 2′′ crossing the green cross in Fig 6. The dashed line shows the rotational temperature T64 (scale in the left y-axis) derived from the p-H2 v = 0–0 S (4)/S (2) line intensity ratio observed with MIRI-MRS (see text).
Current usage metrics show cumulative count of Article Views (full-text article views including HTML views, PDF and ePub downloads, according to the available data) and Abstracts Views on Vision4Press platform.
Data correspond to usage on the plateform after 2015. The current usage metrics is available 48-96 hours after online publication and is updated daily on week days.
Initial download of the metrics may take a while.