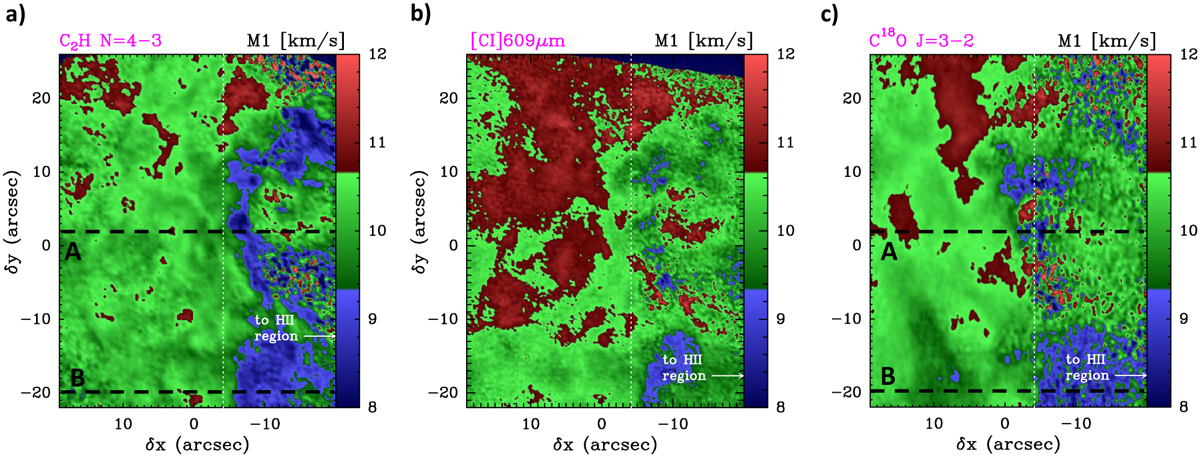
Fig. C.4
Download original image
Intensity-weighted mean LSR velocity maps (moment 1): (a) C2H N = 4–3, (b) [C I] 609 μm, and (c) C18O J = 3–2. The green shaded areas show LSR velocities consistent with emission from the Bar. The blueish points (blue-shifted with respect to the Bar) show emission with more relevant contribution from OMC-1 in the background (e.g., DF1). The reddish points show red-shifted emission from the main velocities of the Bar PDR. We rotated the original images by 37.5∘ clockwise to bring the FUV illuminationin the horizontal direction (from the right).
Current usage metrics show cumulative count of Article Views (full-text article views including HTML views, PDF and ePub downloads, according to the available data) and Abstracts Views on Vision4Press platform.
Data correspond to usage on the plateform after 2015. The current usage metrics is available 48-96 hours after online publication and is updated daily on week days.
Initial download of the metrics may take a while.