Fig. C.3
Download original image
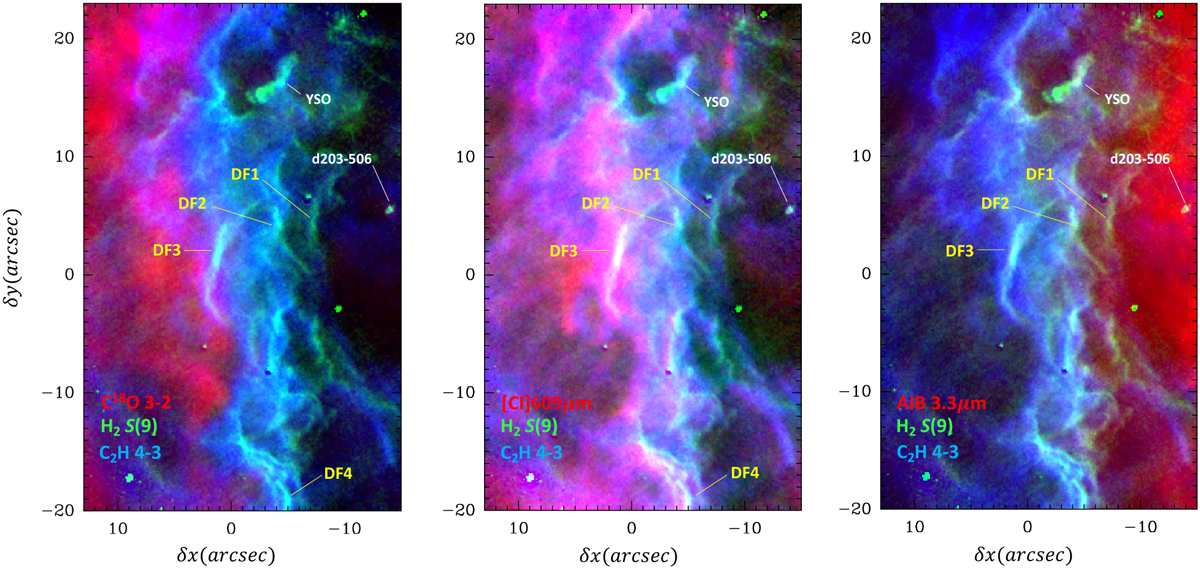
Subarcsecond resolution RGB images of the Bar. Green represents the NIRCam F470M–F480M image (a proxy of the H2 v = 0–0 S (9) emission) and blue represents the C2H N = 4–3, F = 5–4 and F = 4–3 emission observed with ALMA. From left to right, red represents C18O J = 3–2 and [C I] 609 μm observed with ALMA, and JWST/NIRCam F335M–F330M image (PAH emission), respectively. We rotated the original images by 37.5∘ clockwise to bring the FUV illumination from the Trapezium in the horizontal direction (from the right).
Current usage metrics show cumulative count of Article Views (full-text article views including HTML views, PDF and ePub downloads, according to the available data) and Abstracts Views on Vision4Press platform.
Data correspond to usage on the plateform after 2015. The current usage metrics is available 48-96 hours after online publication and is updated daily on week days.
Initial download of the metrics may take a while.