Fig. C.1
Download original image
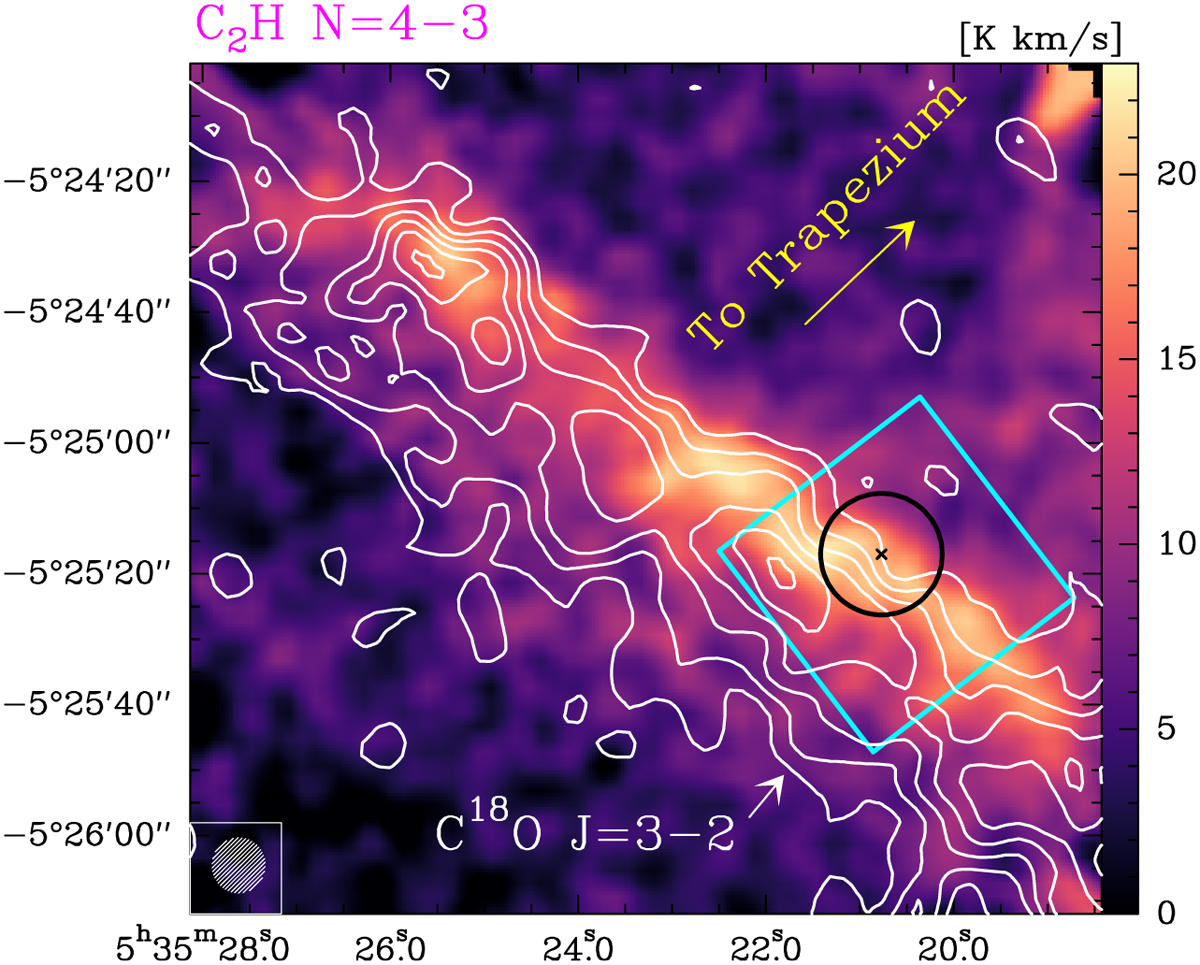
IRAM 30m map of the entire Orion Bar in the C2H 4–3 integrated line emission at ∼8′′ resolution (in R.A. and DEC. coordinates). White contours show the C18O 3–2 emission from 10 to 35 K km s−1 in steps of 5 K km s−1. The cyan square shows the FoV observed with ALMA. The black circle shows the single-dish line survey position (SDLS, Cuadrado et al. 2015) including the FoV observed with JWST.
Current usage metrics show cumulative count of Article Views (full-text article views including HTML views, PDF and ePub downloads, according to the available data) and Abstracts Views on Vision4Press platform.
Data correspond to usage on the plateform after 2015. The current usage metrics is available 48-96 hours after online publication and is updated daily on week days.
Initial download of the metrics may take a while.