Fig. 8
Download original image
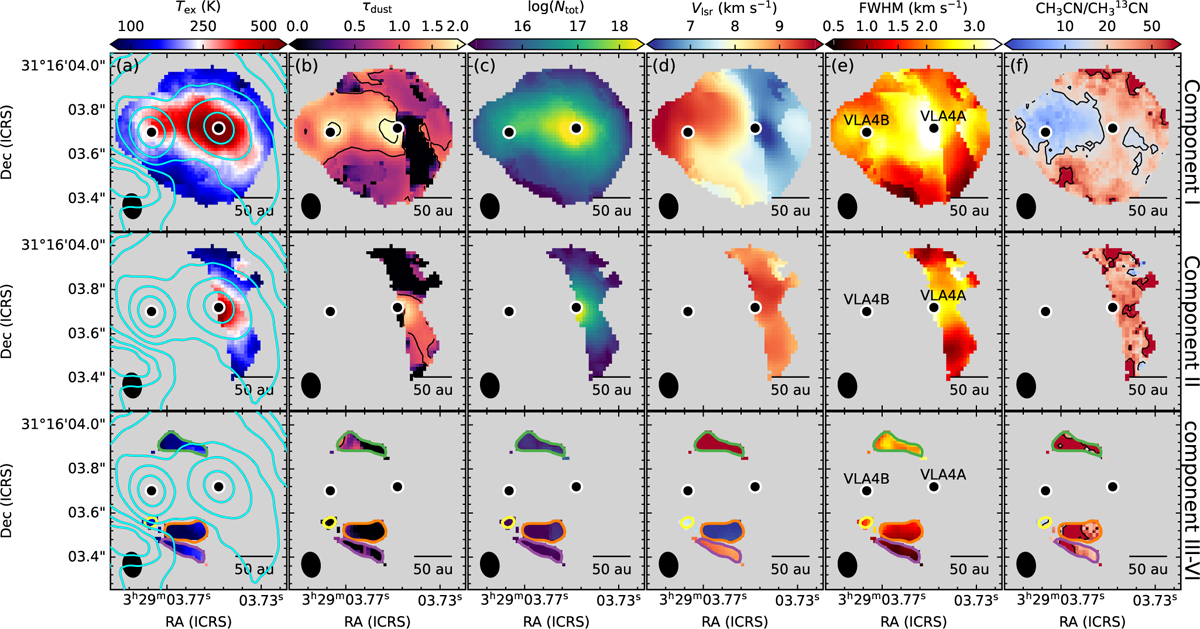
Same as Fig. 5, but for the clustering components. Note: the discarded points are attributed to one-layer fitting in component I. The top, middle, and bottom panels show the parameters for component I, II, and III-VI, respectively. The fourth column shows the Vlsr map, with the systemic velocities of VLA4A and VLA4B calculated as 7.36 and 9.33 km s−1, respectively (Diaz-Rodriguez et al. 2022).
Current usage metrics show cumulative count of Article Views (full-text article views including HTML views, PDF and ePub downloads, according to the available data) and Abstracts Views on Vision4Press platform.
Data correspond to usage on the plateform after 2015. The current usage metrics is available 48-96 hours after online publication and is updated daily on week days.
Initial download of the metrics may take a while.