Fig. 6
Download original image
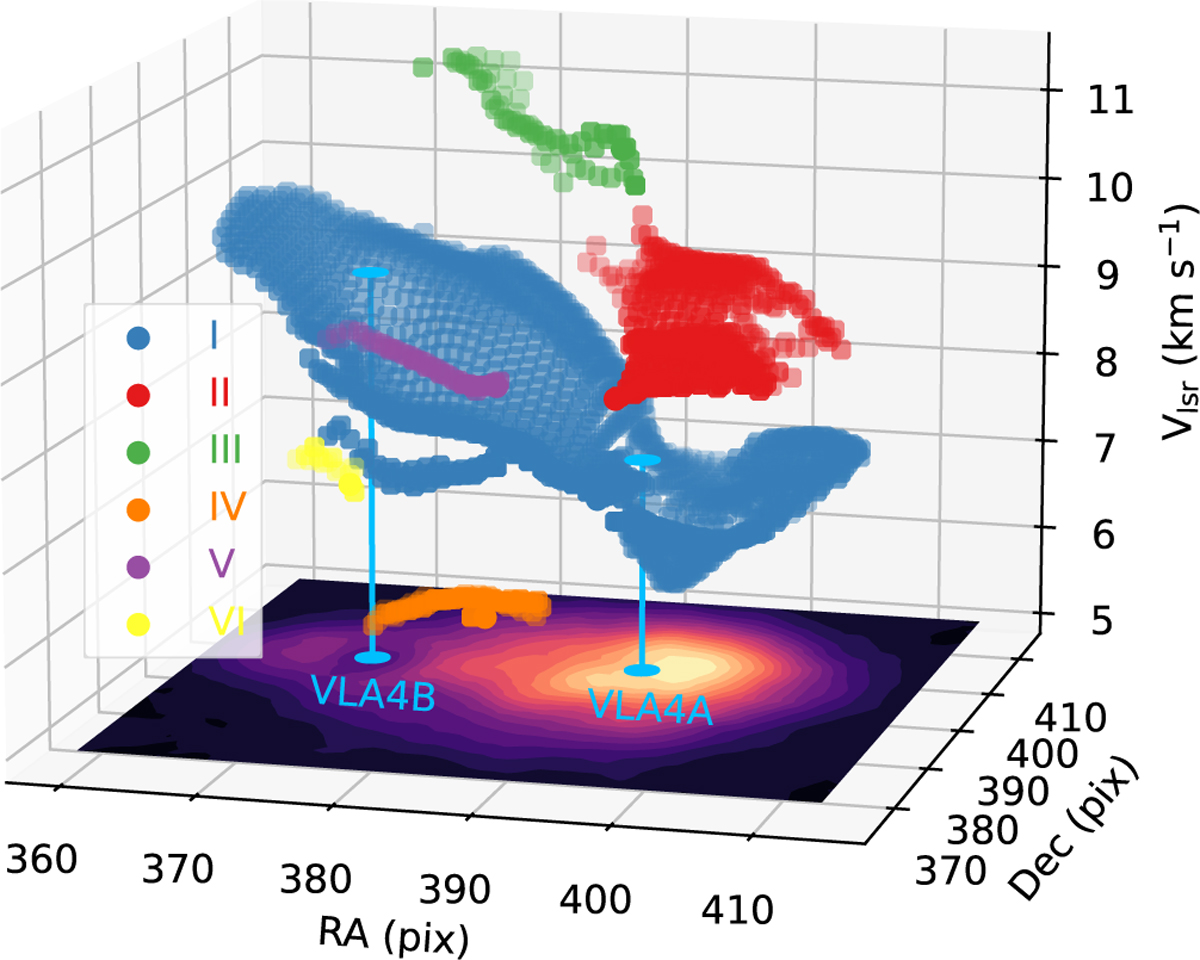
PPV diagram from the combination of one- and two-layer model fitting. The bottom x-y image is the CH3CN J=12-11 K=3 integrated intensity map. Above it, each position can have one or two velocities. The color of data points indicates the kinematic component from clustering. The two cyan vertical lines indicates the positions and the systemic velocities of VLA4A (7.36 km s−1) and VLA4B (9.33 km s−1).
Current usage metrics show cumulative count of Article Views (full-text article views including HTML views, PDF and ePub downloads, according to the available data) and Abstracts Views on Vision4Press platform.
Data correspond to usage on the plateform after 2015. The current usage metrics is available 48-96 hours after online publication and is updated daily on week days.
Initial download of the metrics may take a while.