Open Access
Fig. 2
Download original image
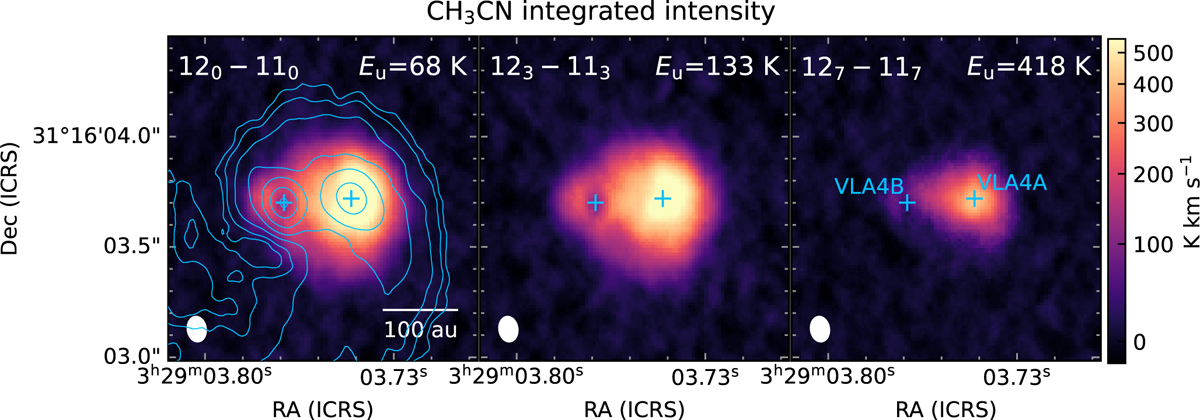
Integrated intensity map of the CH3CN J=12-11 with K=0, 3, and 7. The integration range is 4–12 km s−1. The contours represent the 1.3 mm continuum emission at levels of 3, 5, 10, 20, 50, 150, and 300σ with σ =0.2 K. The blue cross markers indicate the locations of VLA4A and VLA4B from the continuum emission.
Current usage metrics show cumulative count of Article Views (full-text article views including HTML views, PDF and ePub downloads, according to the available data) and Abstracts Views on Vision4Press platform.
Data correspond to usage on the plateform after 2015. The current usage metrics is available 48-96 hours after online publication and is updated daily on week days.
Initial download of the metrics may take a while.