Fig. C.1
Download original image
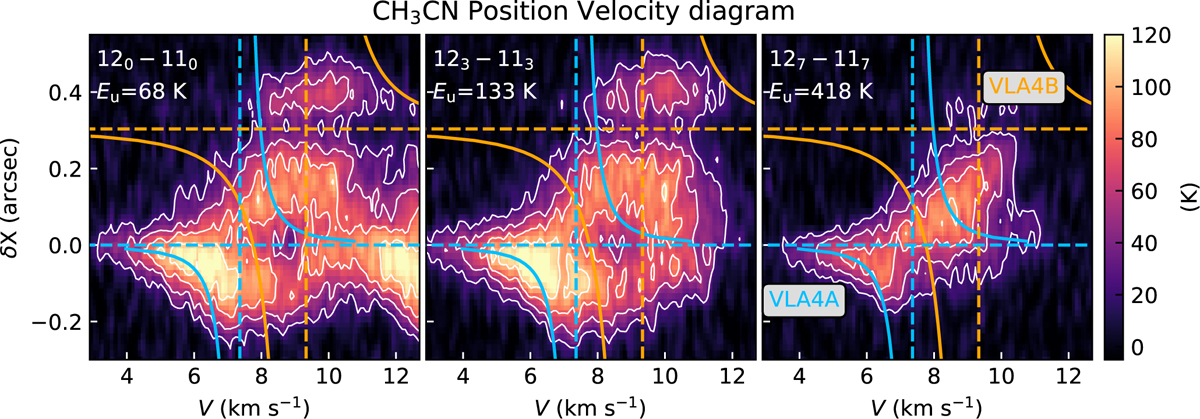
PV diagram of three selected transitions from CH3CN across VLA4A and VLA4B (west to east). The contour levels are at 5, 10, 15, and 20σ. The dashed lines indicate the position and velocity of VLA4A (blue) and VLA4B (orange). The solid curves show Keplerian profiles for each with a Mstar = 0.27M⊙ and θinc = 22° for VLA4A (blue) and Mstar = 0.60M⊙ and θinc = 40° for VLA4B (orange) according to Diaz-Rodriguez et al. (2022).
Current usage metrics show cumulative count of Article Views (full-text article views including HTML views, PDF and ePub downloads, according to the available data) and Abstracts Views on Vision4Press platform.
Data correspond to usage on the plateform after 2015. The current usage metrics is available 48-96 hours after online publication and is updated daily on week days.
Initial download of the metrics may take a while.