Fig. B.2
Download original image
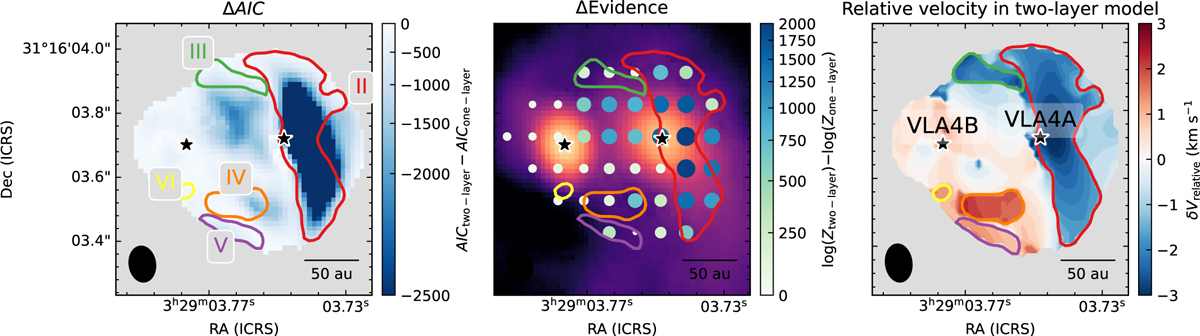
Left: The ΔAIC map between the one-layer and two-layer models. The color contours show the area where the two-layer model is selected and the colors indicate the kinematic components II-VI (I is the main component covering the whole map; see Fig. 6). Middle: Difference of evidences between the two-layer and the one-layer models toward the points with nested sampling overlaid on continuum image. The colors and sizes represent the difference. Right: The relative velocity, i.e., the velocity difference VLSR,2 − VLSR,1 of the layer one (front layer, τ1(υ)) and layer two (rear layer, τ2(υ)) in Eq. A.5, in the two-layer model.
Current usage metrics show cumulative count of Article Views (full-text article views including HTML views, PDF and ePub downloads, according to the available data) and Abstracts Views on Vision4Press platform.
Data correspond to usage on the plateform after 2015. The current usage metrics is available 48-96 hours after online publication and is updated daily on week days.
Initial download of the metrics may take a while.