Fig. 1
Download original image
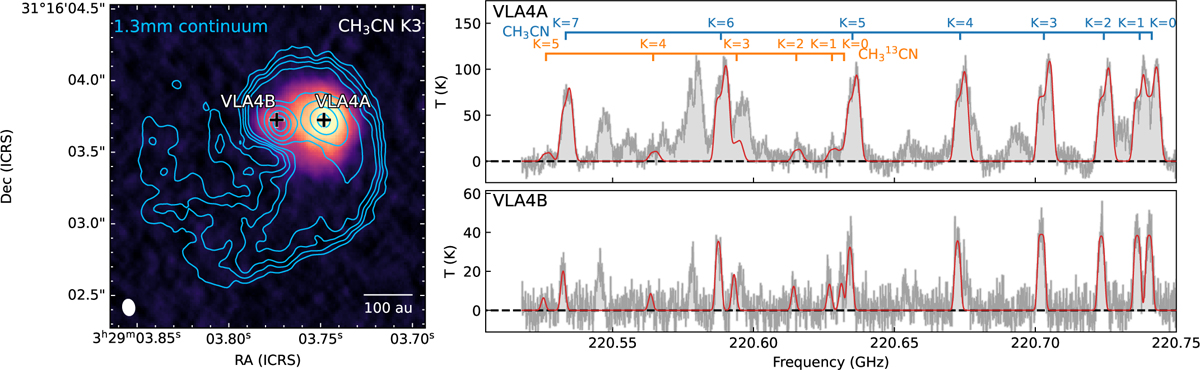
Left: integrated intensity map of the CH3CN J=12-11 K=3 ladder with the contours from 1.3 mm continuum at levels of 3, 5, 7, 10, 20, 40, 100, and 200σ, with σ = 0.2 K. Right: sSpectra seen from the cross-marked positions of VLA4A (top) and VLA4B (bottom) from the CH3CN window. The red lines represent the best fits from our models (see Sects. 4.2.1 and 4.2.2).
Current usage metrics show cumulative count of Article Views (full-text article views including HTML views, PDF and ePub downloads, according to the available data) and Abstracts Views on Vision4Press platform.
Data correspond to usage on the plateform after 2015. The current usage metrics is available 48-96 hours after online publication and is updated daily on week days.
Initial download of the metrics may take a while.