Fig. 5
Download original image
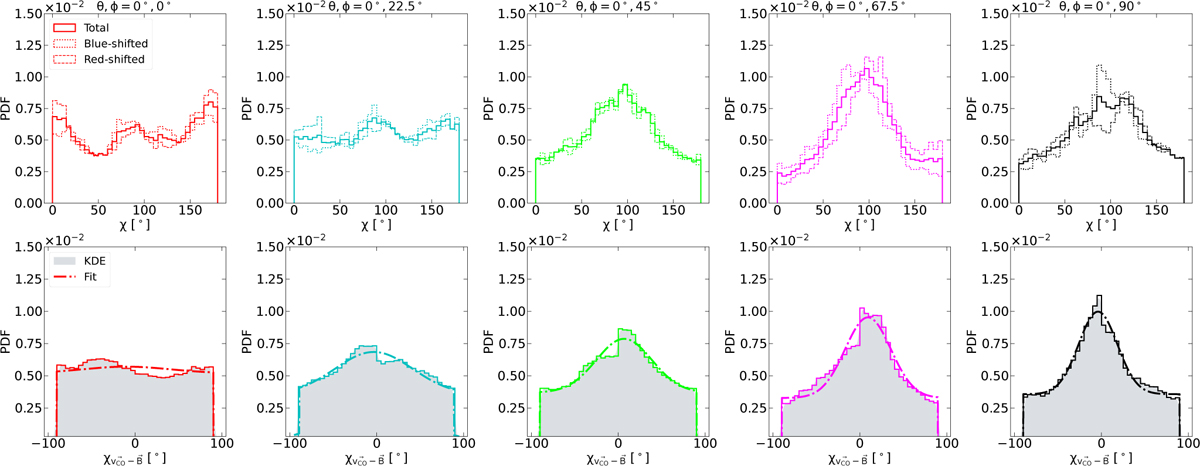
Upper row: PDFs of the orientation of the vectors shown in Fig. 4 with respect to the horizontal axis of the image (i.e., the ξ direction). For every projection angle, we show the total distribution of angles between all successive velocity slices (solid thick lines), the distribution of angles for the blue-shifted components (dotted lines), and the distribution of angles for the red-shifted components (dashed lines). Lower panels: PDFs of the relative orientation between the vectors shown in Fig. 4 and the polarization vectors shown in Fig 2. The shaded region shows a KDE estimate for each distribution and the dashed-dotted line shows a simultaneous fit of a Gaussian and a uniform distribution to the data.
Current usage metrics show cumulative count of Article Views (full-text article views including HTML views, PDF and ePub downloads, according to the available data) and Abstracts Views on Vision4Press platform.
Data correspond to usage on the plateform after 2015. The current usage metrics is available 48-96 hours after online publication and is updated daily on week days.
Initial download of the metrics may take a while.