| Issue |
A&A
Volume 696, April 2025
|
|
|---|---|---|
| Article Number | L15 | |
| Number of page(s) | 7 | |
| Section | Letters to the Editor | |
| DOI | https://doi.org/10.1051/0004-6361/202453225 | |
| Published online | 23 April 2025 | |
Letter to the Editor
The enigmatic magnetic field of the planet hosting Herbig Ae/Be star HD 169142
1
Leibniz-Institut für Astrophysik Potsdam (AIP), An der Sternwarte 16, 14482 Potsdam, Germany
2
European Southern Observatory, Karl-Schwarzschild-Str. 2, 85748 Garching, Germany
⋆ Corresponding author; shubrig@aip.de
Received:
29
November
2024
Accepted:
3
April
2025
Context. Recent observations of the accretion disk around the Herbig Ae/Be star HD 169142 have revealed its complex and asymmetric morphology that indicates the presence of planets. The knowledge of the magnetic field structure in host stars is indispensable for our understanding of the magnetospheric interaction between the central stars, the circumstellar (CS) environment, and the planetary companions.
Aims. We want to study the geometry of the magnetic field of HD 169142.
Methods. We measured the mean longitudinal magnetic field from high-resolution ESPaDOnS and HARPSpol spectra of HD 169142 using the least-squares deconvolution technique. Additionally, the spectral variability of hydrogen lines is studied using dynamical spectra.
Results. Our analysis of the Stokes V spectra reveals the presence of definitely detected narrow Zeeman features observed using line masks with neutral iron lines. On two observing epochs, we also obtain marginally detected broad Zeeman features. To explain the simultaneous appearance of narrow and broad Zeeman features, we discuss different scenarios, including one scenario related to a non-photospheric origin of the narrow Zeeman features due to magnetospheric interaction with warm CS matter. In an environment such as a wind or an accretion disk, spectral lines may form over a relatively large volume, and the field topology may therefore be complex not only in latitude and azimuth, but in radius as well. Dynamical plots of the Hβ line show an intriguing very complex structure with appearing and disappearing absorption features, which can be related to the complex morphology of the CS matter with asymmetric dust clump structures. The profiles of spectral lines belonging to different elements are variable, indicating the presence of chemical spots.
Key words: binaries: spectroscopic / circumstellar matter / stars: magnetic field / stars: individual: HD 169142 / stars: pre-main sequence / stars: variables: T Tauri / Herbig Ae/Be
© The Authors 2025
 Open Access article, published by EDP Sciences, under the terms of the Creative Commons Attribution License (https://creativecommons.org/licenses/by/4.0), which permits unrestricted use, distribution, and reproduction in any medium, provided the original work is properly cited.
This article is published in open access under the Subscribe to Open model. Subscribe to A&A to support open access publication.
1. Introduction
The motivation to search for the presence of a magnetic field and its structure in the rather bright (mV = 7.7) A9-F0 Herbig Ae star HD 169142 at an estimated age of 6 Myr (Grady et al. 2007) arises from the recent detections of several signatures typical of giant planet formation in its face-on protoplanetary disk (e.g. Pohl et al. 2017; Bertrang et al. 2018; Toci et al. 2020). HD 169142 is located at a distance of 114 pc (Guzmán-Díaz et al. 2021) and is surrounded by several ring-like structures (e.g. Law et al. 2023), spirals (e.g. Gratton et al. 2019), and asymmetric dust clump structures at the innermost ring (e.g. Pérez et al. 2019). Numerous studies of the complex and asymmetric morphology of the accretion disk around HD 169142 considered that many of the accretion disk structures originate from planet-disk interactions. The presence of giant planets having a few Jupiter masses, one located inside the inner dust cavity at a distance of less than 20 au and another in the gap between the two dust rings (between 35 and 55 au), has been suggested to explain the appearance of two prominent dust rings (e.g. Fedele et al. 2017; Macías et al. 2019; Pérez et al. 2019). Using a re-reduction of previous SPHERE YJH band observations, Hammond et al. (2023) recently confirmed the detection of a compact source in the face-on protoplanetary disk surrounding HD 169142. To match the position of the observed compact source, the authors included in their model two giant planets with M ∼ 2.5 MJ, one located in the inner cavity, at 17 au, and one located between the two rings, at a position angle of 44°.
While the kinematic pattern and line profiles studied using observations with the Atacama Large Submillimeter Array are consistent with an outer disk seen at 13° inclination from face-on orientation (Raman et al. 2006; Panić et al. 2008), the inner circumstellar (CS) disk with a radius of 2.2 ± 0.6 au has been found to be misaligned between 10 − 23° with respect to the outer disk (e.g. Francis & van der Marel 2020). According to Poblete et al. (2022), the morphology of the disk structure can be represented by a central misaligned CS disk and four more distant rings at 26, 57, 64, and 77 au. To explain the misalignment of the inner disk and the azimuthal concentration of spiral arms at the innermost ring at a distance of 26 au observed by Poblete et al. (2019), the authors suggested the presence of an inner stellar binary and a circumbinary planet. Their 3D hydrodynamical simulations of circumbinary disks using the PHANTOM smoothed particle hydrodynamics code (Price et al. 2018) indicate that a companion with a mass ratio of 0.1, with a semi-major axis of 9.9 au, an eccentricity of 0.2, and an inclination of 90°, together with a 2 MJ coplanar planet on a circular orbit at 45 au reproduce well the structures at the innermost ring observed at 1.3 mm and the shape of the spiral features in scattered light observations. On the other hand, the suggested binarity scenario for HD 169142 is not supported by available spectroscopic (Corporon & Lagrange 1999) and interferometric observations (Kobus et al. 2020), nor by Gaia data (Vioque et al. 2018).
In view of the reported presence of planets in the system HD 169142, a study of the stellar magnetic properties of HD 169142 is particularly valuable for our understanding of the possible magnetic star-planet interaction. Through the stellar wind and the magnetic field, stars usually create a magnetised plasma environment extending outwards into the surrounding space (e.g. Strugarek et al. 2015). Since optical ultra-narrowband imagery of HD 169142 revealed the presence of Hα emission (Grady et al. 2007), this star is expected to possess a magnetosphere (Sundqvist et al. 2012). One of the most common approaches used to investigate the interaction between a magnetic star and a planet is to search for non-thermal chromospheric Ca II H and K excess emissions. These lines are not in emission in the spectra of HD 169142, but, as we show in Fig. A.1 in the Appendix, the line cores are strongly variable and are possibly filled in by emission. Grady et al. (2007) identified HD 169142 as an X-ray and UV line emission source, but no radio monitoring campaign to search for flares has been carried out so far.
To date, about two dozen Herbig Ae/Be stars have been reported to possess large-scale organised magnetic fields with a mean longitudinal magnetic field strength between 0.1 and 1.2 kG (e.g. Hubrig et al. 2009, 2015). Among the magnetic Herbig Ae/Be stars, HD 101412 possesses the strongest surface magnetic field ever measured in any Herbig Ae/Be star, of up to 3.5 kG (Hubrig et al. 2010). The few Herbig Ae/Be stars with intriguing hints of planets have not yet been studied in detail using spectropolarimetry. Alecian et al. (2013) used four spectropolarimetric observations of HD 169142 recorded in 2005 between February 20 and August 24 using the Echelle SpectroPolarimetric Device for the Observation of Stars (ESPaDOnS; Donati et al. 2006) installed at the Canada-France-Hawaii Telescope (CFHT) and reported a non-detection with an upper limit of about 50 − 100 G.
To characterise the magnetic field of HD 169142, we recently acquired additional high-resolution polarimetric spectra using the High Accuracy Radial velocity Planet Searcher polarimeter (HARPSpol; Snik et al. 2008) attached to the European Southern Observatory (ESO) 3.6 m telescope. This paper is laid out as follows. Section 2 describes the obtained observations, their reduction, and the measurement procedure. In Section 3 we consider the distinct variability of line profiles belonging to different elements, and discuss possible scenarios to explain the observed magnetic field structure.
2. Observations and magnetic field measurements
The reduced ESPaDOnS spectra, which are now publicly available in the CFHT archive, have a wavelength coverage from 3700 to 10 480 Å and a spectral resolution of R ≈ 65 000. We complemented the ESPaDOnS observations with four high-resolution (R ≈ 110 000) HARPSpol observations obtained during our visitor run in 2022 April–May (Prg. ID 0109.C-0265(A)). HARPSpol has a wavelength coverage from 3780 to 6910 Å, with a small gap between 5259 and 5337 Å. The data were reduced on La Silla using the HARPSpol data reduction pipeline. The normalisation of the spectra to the continuum level is described in detail by Hubrig et al. (2013). The assessment of the longitudinal magnetic field measurements is presented in our previous papers (e.g. Hubrig et al. 2018; Järvinen et al. 2020). Similarly to the work of Alecian et al. (2013) and our previous studies, to increase the signal-to-noise ratio (S/N) by a multiline approach, we employed the least-squares deconvolution (LSD) technique. The details of this technique, including a description of how the LSD Stokes I, Stokes V, and diagnostic null spectra are calculated, were presented by Donati et al. (1997). The fundamental parameters of HD 169142 have recently been reported in several studies: log g = 4.20 ± 0.25 and vsini = 55 ± 0.8 km s−1 have been reported by Saffe et al. (2021) and the effective temperature Teff = 7250 ± 125 K, the mass  M⊙, and the radius R = 1.51 ± 0.05 R⊙ are listed in the study by Guzmán-Díaz et al. (2021).
The spectrum of HD 169142 is very line-rich, exhibiting numerous Fe I lines. Only lines that appear to be unblended or minimally blended in the Stokes I spectra were included in the line mask. The resulting LSD profiles are scaled according to the line strength and sensitivity to the magnetic field. To evaluate, whether the detected Zeeman features are spurious or definite detections, we followed the generally adopted procedure to use the false alarm probability (FAP) based on reduced χ2 test statistics (Donati et al. 1992): the presence of a Zeeman feature is considered a definite detection (DD) if FAP ≤ 10−5, a marginal detection (MD) if 10−5 < FAP ≤ 10−3, and a non-detection (ND) if FAP > 10−3.
Previous studies of magnetic Herbig Ae/Be stars revealed that different elements typically show different abundance distributions across the stellar surface, and therefore that they sample the magnetic field in different manners (e.g. Hubrig et al. 2010; Järvinen et al. 2016). Thus, the geometry of the magnetic field can potentially be studied by measurements using spectral lines of each element separately. As an example, we show in Fig. B.1 the difference in the strengths of the longitudinal magnetic fields obtained for the magnetic Herbig Ae/Be star HD 98922 (e.g. Hubrig et al. 2013; Järvinen et al. 2019a) using exclusively the Ti II line mask and the line mask containing in addition Cr II and Fe II lines. Therefore, different line masks have been used in the LSD analysis of HD 169142.
In Table 1 we summarise the results of the magnetic field measurements of HD 169142, providing additional information on the Julian date at mid-exposure, the S/N measured at 4510 Å, and the instrument used. In the last column of this table we list our remarks related to the appearance of the Zeeman features detected in the Stokes V spectra. The LSD Stokes I, V, and diagnostic null N spectra for each observation are presented in Fig. 1. Using the line mask with Fe I lines, our measurements show definite detections for all four HARPSpol observations and one ESPaDOnS observation, with longitudinal magnetic field strengths up to 120 G. The definite detection in the ESPaDOnS observation from 2005 May 22 shows a Zeeman crossover-like feature. Such features are usually explained by the presence of magnetic fields of mixed polarities over the visible hemisphere and the rotational Doppler effect in fast-rotating stars. No detection using this line mask was obtained for the ESPaDOnS observation on 2005 August 24. The distinct rather narrow Zeeman features with FAP-values corresponding to definite detections are in most cases shifted relative to the centre of the underlying Stokes I profiles, suggesting that the structure of the magnetic field can be complex with magnetic and/or chemical spots distributed over the stellar surface. For the remaining two ESPaDOnS observations, we employed a line mask containing Fe I and Si II lines.
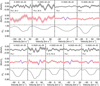 |
Fig. 1. LSD Stokes I, V, and diagnostic null N spectra (from bottom to top) of HD 169142. These are calculated using ESPaDOnS (bottom) and HARPSpol (top) observations. The employed line masks and the dates of observations are indicated. The Stokes V and N spectra are magnified by a factor of 30 for better visibility. The rather narrow Zeeman feature identified in the Stokes V spectra as definite detections are highlighted in blue, whereas the broad Zeeman features identified as marginal detections are highlighted in green. The grey bands in the N spectra and the red bands in the Stokes V spectra correspond to a 1σ uncertainty. |
Logbook of observations and results of magnetic field measurements for the Herbig Ae star HD 169142.
Surprisingly, we detect broad Zeeman features on two different observing epochs: one in the ESPaDOnS observation acquired on 2005 February 20 with ⟨B⟩z = −1310 ± 118 G obtained using the line mask containing Fe I and Si II lines, and another in the HARPSpol observations on 2022 April 28 with ⟨B⟩z = −58 ± 41 G obtained using a line mask containing Cr II and Fe II lines. Both broad Zeeman features highlighted in Fig. 1 in green correspond to marginal detections with FAP = 1.6 × 10⁻⁴ and FAP = 6.3 × 10⁻⁴. For the same HARPSpol observations from 2022 April 28, using a line mask containing Fe I lines, the observed Zeeman feature is much narrower, but shows the same (negative) polarity. It is possible that a weak broad Zeeman feature is also present in the Stokes V spectrum in the observations from 2005 August 24 and as a blend with the narrow Zeeman feature in the observation acquired on 2022 April 29. However, higher quality spectra with much higher S/N are necessary to confirm their appearance.
Inspecting the LSD plots in Fig. 1, we also realise that the diagnostic N spectra obtained for the HARPSpol observation in 2022 April 28 and the ESPaDOnS observation on 2005 February 22 display large irregular structures. These observations have been obtained with the lowest S/N. On the other hand, we suspect that the reason for such an appearance, also for other distinct smaller structures observed in the N spectra calculated for a few other observations, is related to the extremely complex CS environment, which is variable on very short timescales. Since spectropolarimetric exposure times are extremely long, the observations could have been significantly affected by short-time CS variability.
3. Discussion
It is striking that the definitely detected narrow Zeeman features are observed exclusively for line masks containing Fe I lines, whereas the inclusion of lines belonging to ions (Si II, Cr II, or Fe II) produces broad Zeeman features on two epochs, albeit identified as marginal detections. As mentioned in several studies in the past, a strong contamination by CS matter is observed in the spectra of cool Herbig Ae/Be stars with numerous lines of neutral iron (e.g. Hubrig et al. 2009; Järvinen et al. 2015). The study of Järvinen et al. (2015) of the strongly magnetic Herbig Ae/Be star HD 101412 showed that the shape and the position of the LSD Stokes V profiles obtained using a line mask with neutral Fe lines can differ from the position of the Stokes V profiles obtained with masks for iron ions. This has been explained by the contamination caused by surrounding warm CS matter in the form of wind or accretion. While Fe I Stokes V profiles calculated for HD 101412 with an accretion disk inclined by 80 ± 7° (i.e. viewed close to edge-on; Fedele et al. 2008) appear shifted to the blue with respect to the Stokes I profiles, the Fe I Stokes V profiles observed for HD 169142 show shifts to the blue and to the red, and one Stokes V profile shows a crossover shape. The different radial velocity shifts of Fe I of these profiles are probably caused by the different inclination angle of the stellar rotation axis of HD 169142, which is viewed not far from pole-on.
A heavy obscuration by the CS matter can be studied using the line shapes of the hydrogen lines in the HARPSpol and ESPaDOnS spectra. Plots with Hα and Hβ profiles for all observing epochs are presented in Fig. 2. The variability of the core of the Hβ profiles appears especially intriguing as the central part of the core displays two emission peaks in the HARPSpol observations from 2022 April 29 and 30. The central emission is also visible in the ESPaDOnS observations from 2005 May 22, but appears unresolved probably due to the lower spectral resolution. The dynamical plots of the cores of the Hβ lines presented in the left and middle panels of Fig. 3 show a very complex structure with a number of appearing and disappearing absorption features that can be related to the complex morphology of the CS matter with asymmetric dust clump structures. The distance between the emission peaks in velocity space is larger for the observation on April 30, accounting for 135 km s−1, with the red-shifted position of the dip between the emission peaks accounting for 20 km s−1. The strongest emission in the Hα profiles corresponds to the observing epochs where the emission peaks in the core of the Hβ lines are observed.
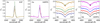 |
Fig. 2. ESPaDOnS and HARPSpol overplotted spectral profiles. Hα profiles are presented in the first and second panels on the left. The other two panels display individual Hβ line profiles in chronological order (oldest at the bottom) and the overplotted profiles at the top. |
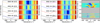 |
Fig. 3. Dynamical spectra. Left and middle: Strongly variable cores of Hβ line profiles in HD 169142 and corresponding dynamical spectra constructed using ESPaDOnS and HARPSpol spectra. Right: Dynamical spectrum calculated for the variable emission Hβ line observed in the SB2 system HD 104237 consisting of a weakly magnetic Herbig Ae/Be star and a strongly magnetic T Tauri component. The ring-like features are centred at the phases where the maximum longitudinal magnetic field is observed. |
It is possible that both emission peaks coming into sight on 2022 April 29 and 30 and highlighted as yellow central strips in Fig. 3 can be related to stellar magnetospheres typically observed in dynamical spectra constructed for hydrogen lines in magnetic upper-main sequence stars (e.g. Küker et al. 2024). Notably, a first spectroscopic imprint of a magnetosphere displaying a ring-like feature centred at the phase where the maximum magnetic field is observed has recently been presented for the nearly face-on Herbig Ae/Be star HD 190073 (Järvinen et al. 2025). The dynamical spectrum constructed for the observed Hβ lines in the nearly face-on SB2 system HD 104237, consisting of a Herbig Ae/Be component and a T Tauri component, also displays a ring-like feature centred at the phase corresponding to the maximum magnetic field in the strongly magnetic T Tauri component (see the right side of Fig. 3). Because of the reported nearly face-on disk orientation in HD 169142, we actually expected to discover a similar ring-like feature for this star as well.
To characterise the variability of the Hβ line cores on short timescales, we also downloaded from the ESO archive two HARPS high-cadence time series acquired on 2008 March 17 and March 21 in the framework of the ESO Prg. ID 080.C-0712(A). The dynamical spectra for these series, each over about two hours, are presented in Fig. C.1. The observed changes in the line cores, the change in the widths and separation of the emission peaks over 131 min on March 21, and small changes in the absorption features over 129.6 min on March 17 seem to confirm that HD 169142 is a fast rotator with a CS matter morphology appearing variable already on short timescales.
Taking into account that the measured longitudinal magnetic field is aspect dependent and changes with rotation phase, to ascertain the structure of the magnetic field, it is necessary to sample different rotation phases. The rotation period of HD 169142 is however unknown. Using vsini = 55 ± 0.8 km s−1 (Saffe et al. 2021), the radius R = 1.51 R⊙ (Guzmán-Díaz et al. 2021), and assuming that the inclination of the stellar rotation axis is the same as the inclination of the outer disks seen at 13°, we obtain a high equatorial velocity of 244 km s−1 and a rotation period of about 0.313 d. For the misalignment of 10 − 23° suggested by Francis & van der Marel (2020), the rotation period can be as long as 0.816 d.
Considering the strong aspect dependence of the measured longitudinal magnetic field and the heavy obscuration by the CS matter clearly detected in the dynamical spectra, we can only speculate that the observed broad Zeeman features might be due to the presence of a globally organised kiloGauss-order photospheric magnetic field, whereas narrow Zeeman features observed for the Fe I line mask are of non-photospheric origin related to the magnetospheric interaction with warm CS matter. On the other hand, in the case of the fast-rotating cool F0-type star HD 169142, it is possible that it still retains a shallow convective zone and that the observed enhanced X-ray and UV line emission may reflect rotational enhancement of chromospheric and transition region activity (Grady et al. 2007). As a result, small-scale magnetic structures would not have Ohmically decayed yet, due to the young age. As the star evolves, it could acquire the more typical dipole-dominated magnetic field like that of Ap/Bp stars. Admittedly, the issue whether cool Herbig Ae/Be stars exhibit small-scale magnetic fields associated with temperature spots typical of those observed in late-type stars is currently unexplored.
In Appendix D in Figs. D.1 and D.2 we show that the line profiles belonging to different elements are variable and appear slightly split at some epochs, which indicates the possible presence of surface chemical spots. The presence of chemical spots has previously been reported also for some other magnetic Herbig Ae/Be stars (e.g. Järvinen et al. 2019b; Hubrig et al. 2010).
The motion of the CS gas in pre-main sequence stars is expected to be governed by the magnetic field. In contrast to T Tauri stars, both the field origin and the way it couples to the CS matter are not clear for Herbig Ae/Be stars. While magnetic surveys of Herbig Ae/Be stars so far mainly targeted the detection of magnetic fields, it is important to understand their three-dimensional structure with respect to the stellar axis and disk orientation. In a CS environment, such as a wind or an accretion disk, spectral lines may form over a relatively large volume, and the field topology may therefore be complex not only in latitude and azimuth, but in radius as well. Future multi-epoch observations of Doppler-shifted spectropolarimetric contributions from photospheric and CS environmental diagnostic lines are necessary to apply for HD 169142 the technique of Zeeman-Doppler tomography. This will allow us to determine the correspondence between the magnetic field structure and the radial density and temperature profiles.
Acknowledgments
We are very grateful to the anonymous referee for their valuable comments. Based on observations made with ESO Telescopes at the La Silla Paranal Observatory under programme IDs 0109.C-0265(A) and 080.C-0712(A), and on observations collected at the Canada-France-Hawaii Telescope (CFHT), which is operated by the National Research Council of Canada, the Institut National des Sciences de l’Univers of the Centre National de la Recherche Scientifique of France, and the University of Hawaii.
References
- Alecian, E., Wade, G. A., Catala, C., et al. 2013, MNRAS, 429, 1001 [NASA ADS] [CrossRef] [Google Scholar]
- Bertrang, G. H. M., Avenhaus, H., Casassus, S., et al. 2018, MNRAS, 474, 5105 [NASA ADS] [CrossRef] [Google Scholar]
- Corporon, P., & Lagrange, A. M. 1999, A&AS, 136, 429 [NASA ADS] [CrossRef] [EDP Sciences] [Google Scholar]
- Donati, J. F., Semel, M., & Rees, D. E. 1992, A&A, 265, 669 [Google Scholar]
- Donati, J. F., Semel, M., Carter, B. D., Rees, D. E., & Collier Cameron, A. 1997, MNRAS, 291, 658 [Google Scholar]
- Donati, J. F., Catala, C., Landstreet, J. D., & Petit, P. 2006, in Solar Polarization 4, eds. R. Casini& B. W. Lites, ASP Conf. Ser., 358, 362 [Google Scholar]
- Fedele, D., van den Ancker, M. E., Acke, B., et al. 2008, A&A, 491, 809 [NASA ADS] [CrossRef] [EDP Sciences] [Google Scholar]
- Fedele, D., Carney, M., Hogerheijde, M. R., et al. 2017, A&A, 600, A72 [NASA ADS] [CrossRef] [EDP Sciences] [Google Scholar]
- Francis, L., & van der Marel, N. 2020, ApJ, 892, 111 [Google Scholar]
- Grady, C. A., Schneider, G., Hamaguchi, K., et al. 2007, ApJ, 665, 1391 [Google Scholar]
- Gratton, R., Ligi, R., Sissa, E., et al. 2019, A&A, 623, A140 [NASA ADS] [CrossRef] [EDP Sciences] [Google Scholar]
- GRAVITY Collaboration (Ganci, V., et al.) 2024, A&A, 684, A200 [NASA ADS] [CrossRef] [EDP Sciences] [Google Scholar]
- Guzmán-Díaz, J., Mendigutía, I., Montesinos, B., et al. 2021, A&A, 650, A182 [NASA ADS] [CrossRef] [EDP Sciences] [Google Scholar]
- Hammond, I., Christiaens, V., Price, D. J., et al. 2023, MNRAS, 522, L51 [NASA ADS] [CrossRef] [Google Scholar]
- Hubrig, S., Stelzer, B., Schöller, M., et al. 2009, A&A, 502, 283 [NASA ADS] [CrossRef] [EDP Sciences] [Google Scholar]
- Hubrig, S., Schöller, M., Savanov, I., et al. 2010, Astr. Nachr., 331, 361 [Google Scholar]
- Hubrig, S., Ilyin, I., Schöller, M., & Lo Curto, G. 2013, Astr. Nachr., 334, 1093 [Google Scholar]
- Hubrig, S., Carroll, T. A., Schöller, M., & Ilyin, I. 2015, MNRAS, 449, L118 [NASA ADS] [CrossRef] [Google Scholar]
- Hubrig, S., Järvinen, S. P., Madej, J., et al. 2018, MNRAS, 477, 3791 [NASA ADS] [Google Scholar]
- Järvinen, S. P., Carroll, T. A., Hubrig, S., et al. 2015, A&A, 584, A15 [NASA ADS] [CrossRef] [EDP Sciences] [Google Scholar]
- Järvinen, S. P., Hubrig, S., Schöller, M., et al. 2016, Astr. Nachr., 337, 329 [Google Scholar]
- Järvinen, S. P., Carroll, T. A., Hubrig, S., Ilyin, I., & Schöller, M. 2019a, MNRAS, 489, 886 [Google Scholar]
- Järvinen, S. P., Carroll, T. A., Hubrig, S., et al. 2019b, MNRAS, 486, 5499 [Google Scholar]
- Järvinen, S. P., Hubrig, S., Mathys, G., et al. 2020, MNRAS, 499, 2734 [CrossRef] [Google Scholar]
- Järvinen, S. P., Hubrig, S., Küker, M., et al. 2025, A&A, 696, A155 [NASA ADS] [CrossRef] [EDP Sciences] [Google Scholar]
- Kobus, J., Wolf, S., Ratzka, T., & Brunngräber, R. 2020, A&A, 642, A104 [NASA ADS] [CrossRef] [EDP Sciences] [Google Scholar]
- Küker, M., Järvinen, S. P., Hubrig, S., Ilyin, I., & Schöller, M. 2024, Astr. Nachr., 345, e20230169 [Google Scholar]
- Law, C. J., Booth, A. S., & Öberg, K. I. 2023, ApJ, 952, L19 [NASA ADS] [CrossRef] [Google Scholar]
- Macías, E., Espaillat, C. C., Osorio, M., et al. 2019, ApJ, 881, 159 [CrossRef] [Google Scholar]
- Panić, O., Hogerheijde, M. R., Wilner, D., & Qi, C. 2008, A&A, 491, 219 [NASA ADS] [CrossRef] [EDP Sciences] [Google Scholar]
- Pérez, S., Casassus, S., Baruteau, C., et al. 2019, AJ, 158, 15 [Google Scholar]
- Poblete, P. P., Cuello, N., & Cuadra, J. 2019, MNRAS, 489, 2204 [NASA ADS] [CrossRef] [Google Scholar]
- Poblete, P. P., Cuello, N., Pérez, S., et al. 2022, MNRAS, 510, 205 [Google Scholar]
- Pohl, A., Benisty, M., Pinilla, P., et al. 2017, ApJ, 850, 52 [Google Scholar]
- Price, D. J., Wurster, J., Tricco, T. S., et al. 2018, PASA, 35, e031 [Google Scholar]
- Raman, A., Lisanti, M., Wilner, D. J., Qi, C., & Hogerheijde, M. 2006, AJ, 131, 2290 [Google Scholar]
- Saffe, C., Miquelarena, P., Alacoria, J., et al. 2021, A&A, 647, A49 [NASA ADS] [CrossRef] [EDP Sciences] [Google Scholar]
- Snik, F., Jeffers, S., Keller, C., et al. 2008, in Ground-based and Airborne Instrumentation for Astronomy II, eds. I. S. McLean,&M. M. Casali, SPIE Conf. Ser., 7014, 70140O [Google Scholar]
- Strugarek, A., Brun, A. S., Matt, S. P., & Réville, V. 2015, ApJ, 815, 111 [Google Scholar]
- Sundqvist, J. O., ud-Doula, A., Owocki, S. P., et al. 2012, MNRAS, 423, L21 [Google Scholar]
- Toci, C., Lodato, G., Fedele, D., Testi, L., & Pinte, C. 2020, ApJ, 888, L4 [Google Scholar]
- Vioque, M., Oudmaijer, R. D., Baines, D., Mendigutía, I., & Pérez-Martínez, R. 2018, A&A, 620, A128 [NASA ADS] [CrossRef] [EDP Sciences] [Google Scholar]
Appendix A: Observed changes in the line profile of the Ca II K line
To show distinct variability of the Ca II K lines, we display in Fig. A.1 the profile of this line on two different epochs. The Ca II K lines appear in absorption, but the line cores are strongly variable and are possibly filled-in by emission.
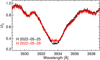 |
Fig. A.1. Ca II K line profiles recorded in the spectra of HD 169142 on two different epochs. |
Appendix B: Magnetic field strength of HD 98022 using different line masks
In Fig. B.1 we show the difference in the appearance of the LSD Stokes V profiles calculated for the magnetic Herbig Ae/Be star HD 98922 (e.g. Hubrig et al. 2013; Järvinen et al. 2019a) using exclusively a Ti II line mask and a line mask containing in addition Cr II and Fe II lines. HD 98922 was found to be consistent with a face-on orientation with a disk inclination of 5 ± 5° (GRAVITY Collaboration 2024). For the strength of the magnetic field using exclusively Ti II lines we obtain 〈B〉z = −211 ± 25 G with FAP = 8.5 × 10⁻¹⁰, whereas the field strength is lower, 〈B〉z = −157 ± 16 G, using in addition the Cr II and Fe II lines, and has a less significant FAP = 1.9 × 10⁻⁸. These results confirm that different elements typically show different abundance distributions across the stellar surface, and therefore sampling the magnetic field in different manners.
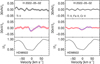 |
Fig. B.1. LSD Stokes I, V, and diagnostic null N spectra (from bottom to top) calculated for HD 98922 observed with HARPSpol on 2022 May 2. The Stokes V and N spectra are magnified by a factor of 30 for better visibility. The Zeeman signatures identified in the Stokes V spectra are highlighted in blue. The grey bands in the N spectra and the red bands in the Stokes V spectra correspond to a 1σ uncertainty. |
Appendix C: Hβ variability in spectroscopic HARPS time series acquired in 2008
In Fig. C.1 we show the Hβ variability in the spectroscopic HARPSpol time series acquired in 2008. The observed changes of the intensities of the cores of the Hβ lines indicates that HD 169142 is most probably a fast rotator with a CS matter morphology appearing variable already on short timescales.
Appendix D: LSD Stokes I profile variability observed for different elements
The LSD Stokes I profiles for Si, Ti, Cr, and Fe are calculated using moderately strong lines that are better suited to monitor the character of the variability. As shown in Fig. D.1, all profiles appear variable with sometimes a slightly split structure, most pronounced in the HARPSpol observations acquired on 2022 April 28. For better visibility of the line profile variability, we also show in Fig. D.2 dynamical spectra for each element. Due to the higher spectral resolution of the HARPSpol observations compared to the ESPaDOnS observations, only the HARPSpol observations are presented. Variability in the line profiles belonging to different elements is usually explained by an inhomogeneous element distribution on the surface of Herbig Ae/Be stars (e.g. Järvinen et al. 2019b; Hubrig et al. 2010).
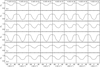 |
Fig. D.1. LSD Stokes I profiles calculated for different elements identified in HARPSpol and ESPaDOnS spectra. |
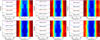 |
Fig. D.2. Dynamical spectra of the LSD Stokes I profiles calculated for different elements identified in the HARPSpol observations. The dark blue colour indicates the areas with chemical spots. |
All Tables
Logbook of observations and results of magnetic field measurements for the Herbig Ae star HD 169142.
All Figures
|
Fig. 1. LSD Stokes I, V, and diagnostic null N spectra (from bottom to top) of HD 169142. These are calculated using ESPaDOnS (bottom) and HARPSpol (top) observations. The employed line masks and the dates of observations are indicated. The Stokes V and N spectra are magnified by a factor of 30 for better visibility. The rather narrow Zeeman feature identified in the Stokes V spectra as definite detections are highlighted in blue, whereas the broad Zeeman features identified as marginal detections are highlighted in green. The grey bands in the N spectra and the red bands in the Stokes V spectra correspond to a 1σ uncertainty. |
| In the text | |
|
Fig. 2. ESPaDOnS and HARPSpol overplotted spectral profiles. Hα profiles are presented in the first and second panels on the left. The other two panels display individual Hβ line profiles in chronological order (oldest at the bottom) and the overplotted profiles at the top. |
| In the text | |
|
Fig. 3. Dynamical spectra. Left and middle: Strongly variable cores of Hβ line profiles in HD 169142 and corresponding dynamical spectra constructed using ESPaDOnS and HARPSpol spectra. Right: Dynamical spectrum calculated for the variable emission Hβ line observed in the SB2 system HD 104237 consisting of a weakly magnetic Herbig Ae/Be star and a strongly magnetic T Tauri component. The ring-like features are centred at the phases where the maximum longitudinal magnetic field is observed. |
| In the text | |
|
Fig. A.1. Ca II K line profiles recorded in the spectra of HD 169142 on two different epochs. |
| In the text | |
|
Fig. B.1. LSD Stokes I, V, and diagnostic null N spectra (from bottom to top) calculated for HD 98922 observed with HARPSpol on 2022 May 2. The Stokes V and N spectra are magnified by a factor of 30 for better visibility. The Zeeman signatures identified in the Stokes V spectra are highlighted in blue. The grey bands in the N spectra and the red bands in the Stokes V spectra correspond to a 1σ uncertainty. |
| In the text | |
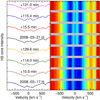 |
Fig. C.1. Similar to Fig. 3, but for the spectroscopic HARPSpol time series acquired in 2008. |
| In the text | |
|
Fig. D.1. LSD Stokes I profiles calculated for different elements identified in HARPSpol and ESPaDOnS spectra. |
| In the text | |
|
Fig. D.2. Dynamical spectra of the LSD Stokes I profiles calculated for different elements identified in the HARPSpol observations. The dark blue colour indicates the areas with chemical spots. |
| In the text | |
Current usage metrics show cumulative count of Article Views (full-text article views including HTML views, PDF and ePub downloads, according to the available data) and Abstracts Views on Vision4Press platform.
Data correspond to usage on the plateform after 2015. The current usage metrics is available 48-96 hours after online publication and is updated daily on week days.
Initial download of the metrics may take a while.