Fig. 1.
Download original image
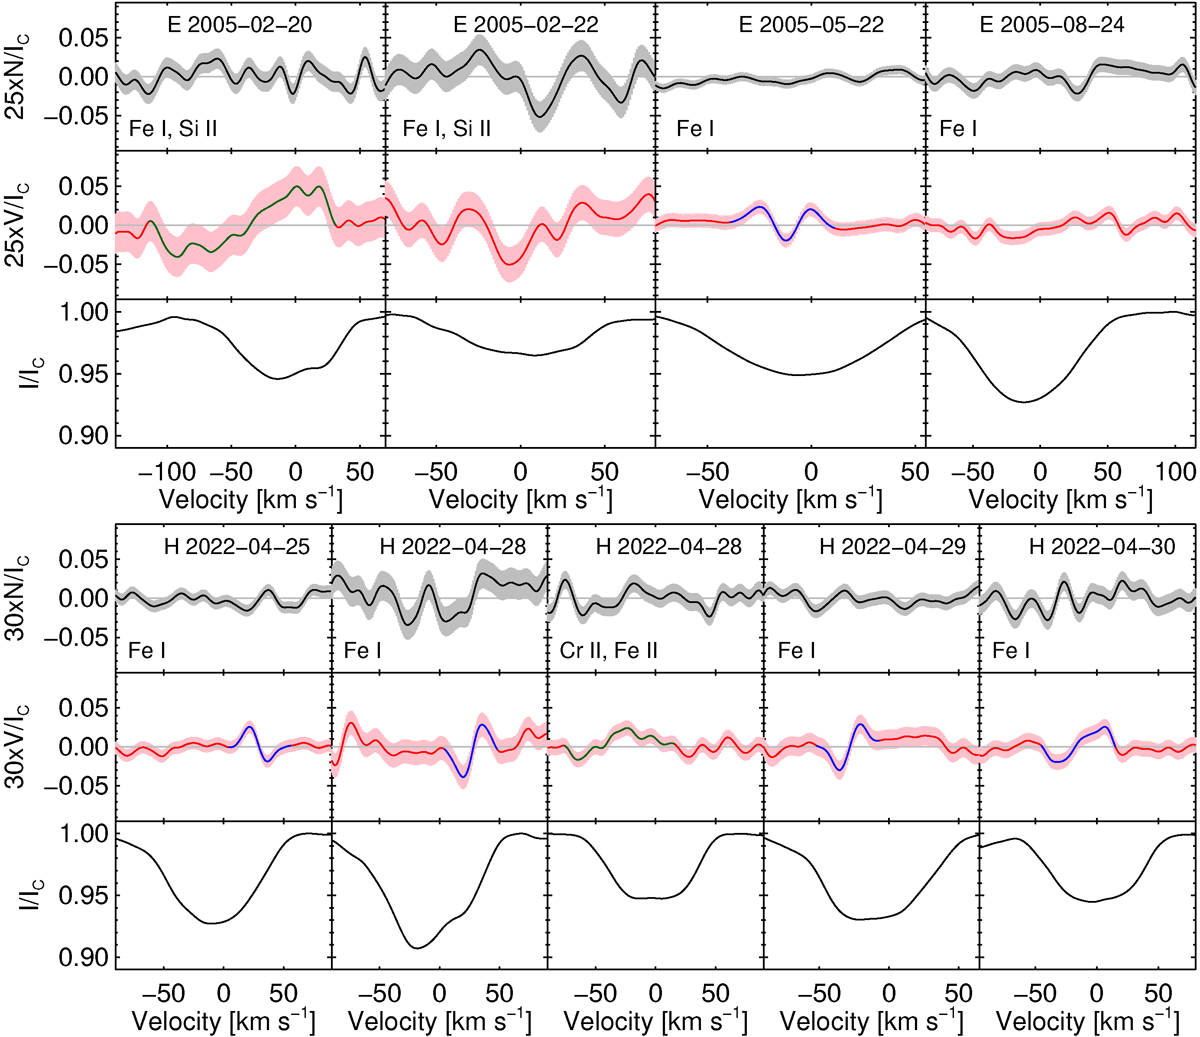
LSD Stokes I, V, and diagnostic null N spectra (from bottom to top) of HD 169142. These are calculated using ESPaDOnS (bottom) and HARPSpol (top) observations. The employed line masks and the dates of observations are indicated. The Stokes V and N spectra are magnified by a factor of 30 for better visibility. The rather narrow Zeeman feature identified in the Stokes V spectra as definite detections are highlighted in blue, whereas the broad Zeeman features identified as marginal detections are highlighted in green. The grey bands in the N spectra and the red bands in the Stokes V spectra correspond to a 1σ uncertainty.
Current usage metrics show cumulative count of Article Views (full-text article views including HTML views, PDF and ePub downloads, according to the available data) and Abstracts Views on Vision4Press platform.
Data correspond to usage on the plateform after 2015. The current usage metrics is available 48-96 hours after online publication and is updated daily on week days.
Initial download of the metrics may take a while.