Fig. A.1
Download original image
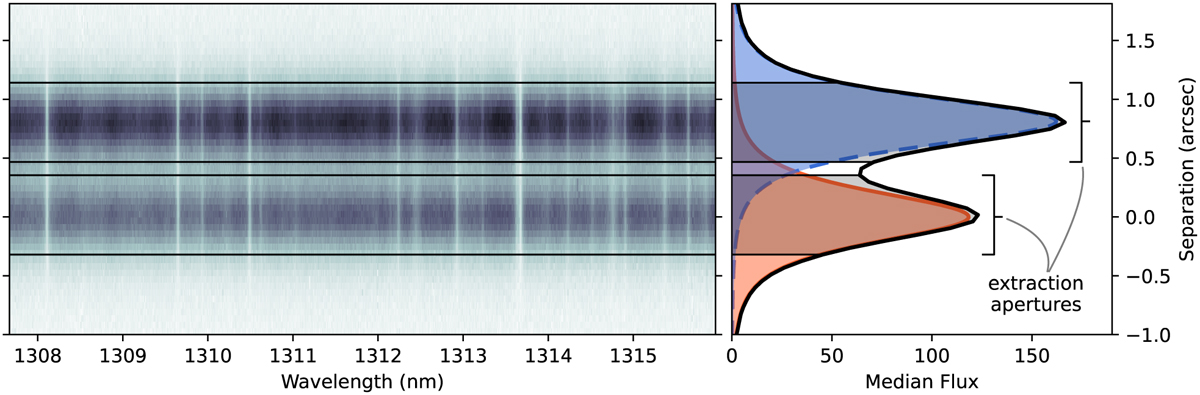
Assessment of the spectral blending in the 23rd chip (centred at ~1312 nm). Left panel: Two-dimensional spectrum, showing emission from Luhman 16B and A at the top and bottom, respectively. The vertical lines show the strong absorption from tellurics. Right panel: Median spatial profile (black) along with fitted Moffat functions, ΦA (orange) and ΦB (blue). The flux within the 12-pixel-wide extraction apertures includes contamination from the unwanted binary component.
Current usage metrics show cumulative count of Article Views (full-text article views including HTML views, PDF and ePub downloads, according to the available data) and Abstracts Views on Vision4Press platform.
Data correspond to usage on the plateform after 2015. The current usage metrics is available 48-96 hours after online publication and is updated daily on week days.
Initial download of the metrics may take a while.