Fig. 7
Download original image
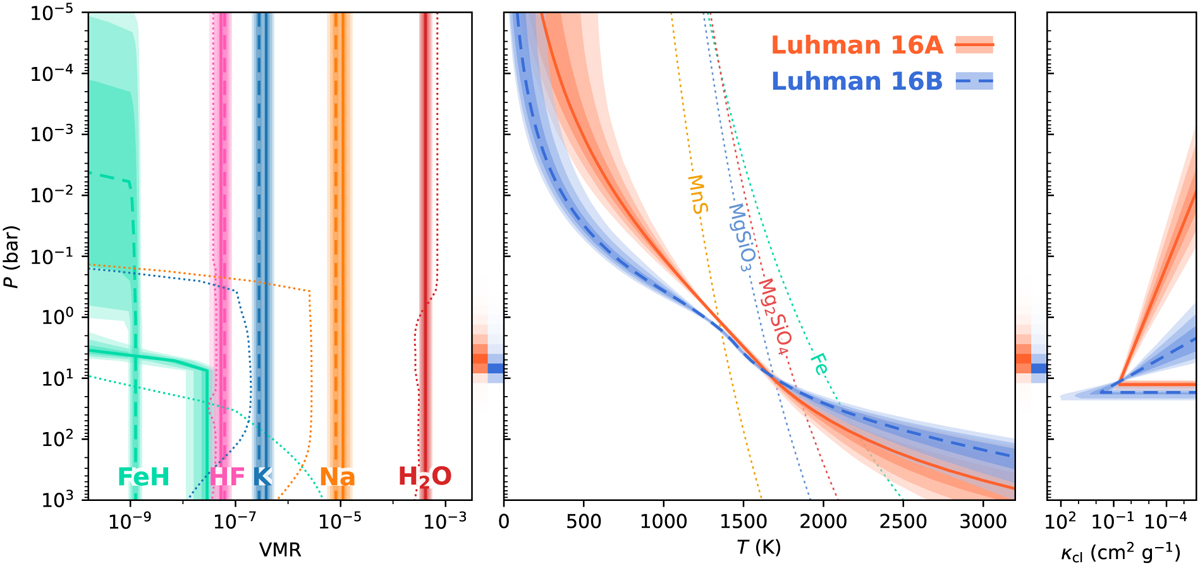
Retrieved vertical profiles of Luhman 16A (solid) and Luhman 16B (dashed). Left panel: chemical abundances and the 68, 95, and 99.7% confidence envelopes of each species for both brown dwarfs. The dotted lines show the chemical-equilibrium abundances computed with FastChem (Kitzmann et al. 2024). With the exception of FeH, the modelled abundances are constant with altitude and thus do not show the drop-offs exhibited by the equilibrium profiles. Middle panel: inferred temperature profiles and the condensation curves (dotted) of four cloud species (Visscher et al. 2006, 2010). Right panel: grey-cloud opacities retrieved as a function of altitude. The orange and blue shading in the panel gaps indicate the Luhman 16AB photospheres as obtained with the integrated emission contribution functions.
Current usage metrics show cumulative count of Article Views (full-text article views including HTML views, PDF and ePub downloads, according to the available data) and Abstracts Views on Vision4Press platform.
Data correspond to usage on the plateform after 2015. The current usage metrics is available 48-96 hours after online publication and is updated daily on week days.
Initial download of the metrics may take a while.